Lennar Corporation, Miami (NYSE: LEN and LEN.B) on Tuesday reported net income of $310.3 million, or $0.94 per diluted share, for its second quarter ended May 31, compared to second quarter net earnings attributable to Lennar in 2017 of $213.6 million, or $0.89 per diluted share. Earnings in the second quarter of 2018 were reduced by $236.8 million ($0.58 per diluted share) of pretax backlog/construction in progress write-up related to purchase accounting and $23.9 million ($0.06 per diluted share) of pretax acquisition and integration costs related to CalAtlantic.
Wall Street was expecting a gain of $0.45 per share. Shares of Lennar shot up more than 7% to $52.76 in pre-market trading Tuesday and held above a 5% gain through mid-afternoon. Lennar sent several other builder stocks up, based largely on Lennar Executive Chairman Stuart Miller’s statement that “concerns about rising interest rates and construction costs have been offset by low unemployment and increasing wages.”
Among the results:
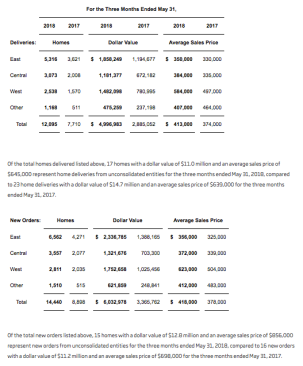
- Deliveries of 12,095 homes – up 57%
- New orders of 14,440 homes – up 62%; new orders dollar value of $6.0 billion – up 79%
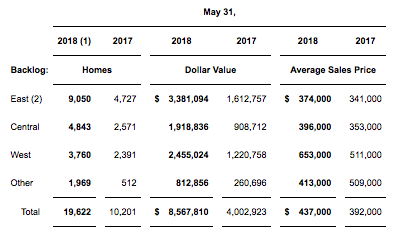
- Backlog of 19,622 homes – up 92%; backlog dollar value of $8.6 billion – up 114%
- Revenues of $5.5 billion – up 67%
- Lennar Home building operating earnings of $425.5 million, compared to $332.6 million
- Gross margin on home sales of 16.8% (21.6% excluding backlog/construction in progress write-up related to purchase accounting), compared to 21.5%
- S,G&A expenses as a % of revenues from home sales of 8.7% – improved 60 basis points
- Operating margin on home sales of 8.2% (12.9% excluding backlog/construction in progress write-up related to purchase accounting), compared to 12.1%
- Lennar Financial Services operating earnings of $52.4 million, compared to $43.7 million
- Rialto operating earnings (net of noncontrolling interests) of $7.0 million, compared to $6.2 million
- Lennar Multifamily operating earnings of $14.8 million, compared to $6.5 million
- Lennar Home building cash and cash equivalents of $932 million
- Lennar Home building debt to total capital, net of cash and cash equivalents, of 40.0%
Stuart Miller, executive chairman of Lennar, said, “Concerns about rising interest rates and construction costs have been offset by low unemployment and increasing wages, combined with short supply based on years of underproduction of new homes. Demand remained strong as we continued to see pricing power support margins while affordability remained consistent. During the quarter, we used our strong cash flow generation to reduce our debt levels by $1.1 billion, paying off $825 million of home building debt maturities in May and early June as well as the remaining $250 million of Rialto’s senior notes without refinancing.”
Rick Beckwitt, CEO of Lennar, said, “Our core homebuilding business had a strong second quarter with new orders and deliveries up 62% and 57%, respectively. Our homebuilding gross margin was 21.6% when adjusted to eliminate the effects of the write-up of CalAtlantic backlog and construction in progress in purchase accounting. Our SG&A of 8.7% marked an all-time second-quarter low which is further evidence of the power of our geographic scale which has led to greater efficiencies in both volume and in utilizing our enhanced technology platform to reduce costs.”
Revenues from home sales increased 74% in the second quarter of 2018 to $5.0 billion from $2.9 billion in the second quarter of 2017. Revenues were higher primarily due to a 57% increase in the number of home deliveries, excluding unconsolidated entities, and an 11% increase in the average sales price of homes delivered. New home deliveries, excluding unconsolidated entities, increased to 12,078 homes in the second quarter of 2018 from 7,687 homes in the second quarter of 2017. There was an increase in home deliveries in all of the company’s home building segments and home building other primarily as a result of the significant increase in volume resulting from the CalAtlantic acquisition. The average sales price of homes delivered was $413,000 in the second quarter of 2018, compared to $374,000 in the second quarter of 2017. The increase in average sales price is primarily resulting from the CalAtlantic acquisition. Sales incentives offered to homebuyers were $23,000 per home delivered in the second quarter of 2018, or 5.3% as a percentage of home sales revenue, compared to $22,700 per home delivered in the second quarter of 2017, or 5.7% as a percentage of home sales revenue, and $22,300 per home delivered in the first quarter of 2018, or 5.4% as a percentage of home sales revenue.
Gross margins on home sales were $840.0 million, or 16.8%, in the second quarter of 2018. Excluding the backlog/construction in progress write-up of $236.8 million related to purchase accounting adjustments on CalAtlantic homes that were delivered in the second quarter of 2018, gross margins on home sales were $1.1 billion or 21.6%. This compared to gross margins on home sales of $616.9 million, or 21.5%, in the second quarter of 2017. Gross margin percentage on home sales increased compared to the second quarter of 2017 primarily due to an increase in the average sales price of homes delivered, partially offset by higher construction costs.
Selling, general and administrative expenses were $432.5 million in the second quarter of 2018, compared to $268.4 million in the second quarter of 2017. As a percentage of revenues from home sales, selling, general and administrative expenses improved to 8.7% in the second quarter of 2018, from 9.3% in the second quarter of 2017, due to improved operating leverage as a result of an increase in home deliveries and continued benefit from technology initiatives. WCI Communities, Inc. (“WCI”) transaction-related expenses had a negative 20 basis point impact to selling, general and administrative expenses as a percentage of revenues from home sales in the second quarter of 2017.
Gross profits on land sales were $20.3 million in the three months ended May 31, 2018, which included profits of $15.0 million on two strategic land sales. This compared to gross profits on land sales of $1.7 million in the three months ended May 31, 2017. Lennar home building equity in loss from unconsolidated entities was $12.2 million in the second quarter of 2018, compared to $21.5 million in the second quarter of 2017. In the second quarter of 2018, Lennar home building equity in loss from unconsolidated entities was primarily attributable to the company’s share of valuation adjustments related to assets of a Lennar Home building unconsolidated entity and the company’s share of net operating losses from its unconsolidated entities. In the second quarter of 2017, Lennar home building equity in loss from unconsolidated entities was primarily attributable to the Company’s share of net operating losses from its unconsolidated entities, primarily driven by general and administrative expenses, as there were no significant land sale transactions. Lennar home building other income, net, was $9.8 million in the second quarter of 2018, compared to $3.8 million in the second quarter of 2017.
Lennar home building interest expense was $75.8 million in the second quarter of 2018 ($71.9 million was included in costs of homes sold, $0.9 million in costs of land sold and $3.0 million in other income, net), compared to $71.9 million in the second quarter of 2017 ($69.9 million was included in costs of homes sold, $0.7 million in costs of land sold and $1.3 million in other income, net). Interest expense included in costs of homes sold increased primarily due to an increase in home deliveries.
Lennar Financial Services
Operating earnings for the Lennar Financial Services segment were $52.4 million in the second quarter of 2018, compared to $43.7 million in the second quarter of 2017. Operating earnings were impacted by an increase in the segment’s title and mortgage operations due to the acquisition of CalAtlantic’s Financial Services operations, partially offset by a decrease in refinance transactions and lower mortgage profit per loan originated.
Rialto
Operating earnings for the Rialto segment were $7.0 million in the second quarter of 2018 (which included $6.9 million of operating earnings and an add back of $0.1 million of net loss attributable to noncontrolling interests). Operating earnings in the second quarter of 2017 were $6.2 million (which included a $6.5 million operating loss and an add back of $12.6 million of net loss attributable to noncontrolling interests). The increase in operating earnings was primarily due to a decrease in real estate owned and loan impairments due to the liquidation of the FDIC and bank portfolios as well as a decrease in general and administrative expenses. The increase in operating earnings was partially offset by a decrease in Rialto Mortgage Finance (“RMF”) securitization revenues as a result of lower volume as well as decreases in incentive and management fee income.
Lennar Multifamily
Operating earnings for the Lennar Multifamily segment were $14.8 million in the second quarter of 2018, primarily due to the segment’s $17.4 million share of gains as a result of the sale of two operating properties by two of Lennar Multifamily’s unconsolidated entities and $5.2 million of promote revenue related to two properties in the Lennar Multifamily Venture Fund I (“LMV Fund I”), partially offset by general and administrative expenses. In the second quarter of 2017, the Lennar Multifamily segment had operating earnings of $6.5 million primarily due to the segment’s $11.4 million share of gains as a result of the sale of an operating property by one of Lennar Multifamily’s unconsolidated entities, partially offset by general and administrative expenses.
Corporate General and Administrative Expenses
Corporate general and administrative expenses were $84.9 million, or 1.6% as a percentage of total revenues, in the second quarter of 2018, compared to $66.8 million, or 2.0% as a percentage of total revenues, in the second quarter of 2017. The decrease in corporate general and administrative expenses as a percentage of total revenues is due to improved operating leverage as a result of an increase in revenues.
Noncontrolling Interests
Net earnings (loss) attributable to noncontrolling interests were $4.6 million and ($12.9) million in the second quarter of 2018 and 2017, respectively. Net earnings attributable to noncontrolling interests during the second quarter of 2018 were primarily attributable to net earnings related to the Lennar home building consolidated joint ventures. Net loss attributable to noncontrolling interests in the second quarter of 2017 was primarily attributable to a net loss related to the FDIC’s interest in the portfolio of real estate loans that the company acquired in partnership with the FDIC.