This article is the fifth in a series addressing how to manage your custom building company using systems and reports. This month’s article addresses the most misunderstood of all the financial management reports: the comparative balance sheet.
A balance sheet is a statement showing the assets, liabilities, and equity of a business entity at a specific date. This statement is also referred to as a statement of financial position or a statement of financial condition. This sheet shows net balances at the end of an accounting period, rather than the total transactions for the period presented in the income statement. The balance sheet allows the custom builder to know how much cash he has in the bank, how much money he is owed, what equipment is on hand, etc., at a given period of time, usually at the close of an accounting period. Assets, liabilities, and owners’ or stockholders’ equity make up the balance sheet. Assets and liabilities are divided into short- and long-term obligations, including cash accounts such as checking, money market, or government securities. Assets are what the firm has, and liabilities are what the firm owes. The difference between the two, or equity, is what the firm owns. For example, if the firm’s assets are $1 million and its liabilities are $600,000, its equity is $400,000. Assets minus liabilities equal equity. At any given time, assets must equal liabilities plus owners’ equity.
The particular elements of a balance sheet may vary significantly from day to day. Over time, these “snapshots” of a company, taken on a yearly or monthly basis, can reveal important information about the company’s ability to satisfy its creditors, manage inventory, and collect its receivables.
Proper analysis of a balance sheet will help a custom builder understand and evaluate his financial strength, liquidity, and leverage. It will also provide management with information that will help in the formulation and monitoring of company goals and plans.
Trend Watch. A balance sheet helps a builder quickly get a handle on the financial strength and capabilities of the business. Is the business in a position to expand? Can it easily handle the normal financial ebbs and flows of revenues and expenses? Or should the owner take immediate steps to bolster cash reserves?
Analyzing the balance sheet also provides information on changes in the financial structure of a custom building company. Observing changes and identifying trends reveal what good and bad things are happening to the company. Trends are more useful than numbers. If there is a trend, it’s important to determine whether it is good or bad, and then, if necessary, take appropriate action.
The best way for a custom builder to look at his balance sheet is to make a side-by-side comparison of the balances as of the end of the current month with the prior month in a column that reflects the change between the periods. Many accounting systems compare the current month balances to the same period in the prior year. This may work for companies in other industries; however, I believe that really doesn’t provide much of a basis for analysis for custom builders. Comparing balances between the end of the current month and the prior month will let a custom builder see the changes that have occurred in assets, liabilities, and equity during the month.
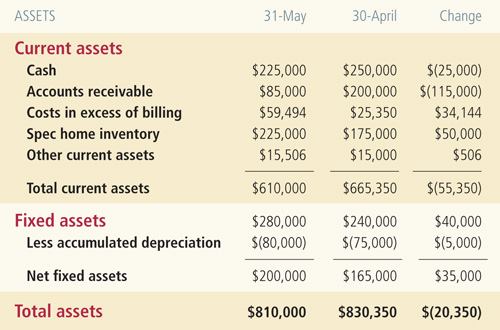
See examples of Sample Custom Builders’ comparative balance sheet as of May 31, 2007, broken down into an Asset sheet and a Liabilities and Equity sheet. This analysis will refer back to previous reports, including the nine-column income statement (July/August 2007) and work in progress (September/October 2007). By using the balance sheet to analyze liquidity, a custom builder should be able to answer questions such as: What are the company’s sources and uses of cash? How much working capital does the company have and how much does it need? Should the company take steps to bolster cash reserves?
Cash Issues. Liquidity is the ability of the firm to meet debts when they come due. This means that the firm must have sufficient cash to meet current liabilities. These liabilities include accounts payable, operating loans, and the current portion of notes and mortgages. The cash to pay these debts comes from current assets. Current assets include items such as cash, cash equivalents, inventory, and receivables. There must be enough of these, as cash, to pay the bills. If there is, the firm is liquid. If there is insufficient cash, the firm is illiquid and must raise cash by selling assets or borrowing to meet the current liabilities.
Working capital is a useful liquidity tool. It is determined by subtracting current liabilities from current assets. Quick working capital looks at working capital more critically. Its concept is that some current assets are not as liquid as other assets. Nothing is as liquid as cash. Liquid current assets include items that can be sold quickly without a discount and is computed by subtracting inventory and current liabilities (less construction loans) from current assets.
Liquidity can also be analyzed through two important ratios. The current ratio is the most popular measure of a company’s solvency. It compares the amount of current assets with which payments can be made to the amount of current liabilities requiring payment. The higher the ratio, the more capable the company is in meeting its current obligations. A ratio of 1.3, meaning the firm has $1.30 of current assets for every dollar of current liability is often considered the ideal. A ratio below 1.0 or a downward trend from 1.3 can be an indication of potential cash flow problems, while a ratio above 1.6 can indicate reluctance to fully utilize your credit position.
Current Ratio = Current Assets/Current Liabilities
Examining Sample Custom Builders’ balance sheet we notice that although the company’s liquidity improved between April and May, it still has negative working capital of $33,500 ($610,000 of current assets – $643,500 of current liabilities), which results in a current ratio of .95 ($610.000/$643,500), up from .91 at the end of April and a quick ratio of .91 (up from .84).
During the month of May, the builder had a profit of $100,500 (change in year-to-date net income between the months), but working capital only increased by $45,150. By not understanding the company’s working capital position at the end of April, Sample made some moves that could hurt the company in the future.
First, the company purchased $40,000 of fixed assets using a loan of only $25,000. In this transaction they transferred a current asset (cash) to buy a non-current asset (equipment), thus reducing the company’s already low working capital.
The owner took a distribution of $45,000 during the month, which also pulled precious working capital from the company. If it wasn’t for overbilling customers ($342,382) and being aggressive on construction loan draws, which exceed costs to date on the spec home by $5,000 as of the end of May, Sample Custom Builders would have difficulty meeting its current liability obligations.
Debt to Equity. Analysis of leverage can provide answers to the question of how much money the owner should have in the company as opposed to using other people’s money. The debt-to-equity ratio is a key measure of the company’s leverage factor. Banks strongly rely on this ratio in their evaluation of a company’s credit worthiness. The higher the ratio, the more risk creditors assume. Custom builders with a high debt-to-equity ratio may have trouble getting construction loans. If they do get the loans, they will probably pay higher rates than builders who are not so highly leveraged. Conversely, a lower ratio usually indicates that the company has more borrowing capacity and greater long-term financial stability. A debt-to-equity ratio of 4:1 means that for every $1 of owners’ equity the company is using $4 of other people’s money (debt). A debt-to-equity ratio less than 4 to 1 is usually considered good.
Debt-To-Equity Ratio = Total Liabilities/Total Owner’s Equity
Examining Sample Custom Builders’ balance sheet, we notice that the company is highly leveraged with only $61,500 of equity and a debt-to-equity ratio of 12.17—a significant improvement from the prior month-end of 129.76 but still a potential concern from the bank’s point of view.
Steve Maltzman, CPA, is president of SMA Consulting in Redlands, Calif. In the next article in this series, he will examine how to use cash flow projections to manage Sample Custom Builders’ low working capital position.