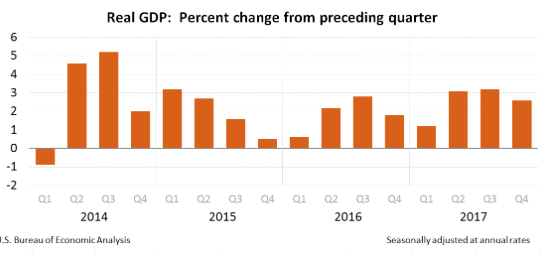
Real gross domestic product (GDP) increased at an annual rate of 2.6% in the fourth quarter of 2017 (table 1), according to the advance estimate released by the Bureau of Economic Analysis. In the third quarter, real GDP increased 3.2%, and economists were expecting growth of 2.9%.
The Bureau emphasized that the fourth-quarter advance estimate released today is based on source data that are incomplete or subject to further revision by the source agency (see “Source Data for the Advance Estimate” on page 3). The “second” estimate for the fourth quarter, based on more complete data, will be released on February 28, 2018.
The increase in real GDP in the fourth quarter reflected positive contributions from personal consumption expenditures (PCE), nonresidential fixed investment, exports, residential fixed investment, state and local government spending, and federal government spending that were partly offset by a negative contribution from private inventory investment. Imports, which are a subtraction in the calculation of GDP, increased.
The deceleration in real GDP growth in the fourth quarter reflected a downturn in private inventory investment that was partly offset by accelerations in PCE, exports, nonresidential fixed investment, state and local government spending, and federal government spending, and an upturn in residential fixed investment. Imports, which are a subtraction in the calculation of GDP, turned up.
Lawrence Yun, chief economist for the National Association of Realtors, believes that if new-home construction was running along at its historical norm, the GDP rise would have matched expectations. “The economy expanded at a respectable rate of 2.3% in 2017. That’s a good comeback considering a very weak start of only 1.2% growth in the first quarter,” Yun said. “The housing market performed reasonably well last year with decade highs in new and existing home sales. But housing construction still did not fully get back to historically normal levels. Only 1.2 million housing units were constructed compared to the historical average of 1.5 million starts a year. This underproduction is the principal cause of the ongoing housing shortage, and why the economy did not fully get back up to 3% GDP growth possibility last year. Even in the private business sector, spending for equipment and software soared, but not for commercial building constructions.”
Yun concluded, “For 2018, the tax cuts that go into effect will provide a lift, and GDP growth of 3% is likely. But to have even faster expansion, along with strengthening wage and income gains, real estate construction has to significantly ramp up and show robust gains. Liberating small-sized community banks from big-bank regulations will permit more construction loans, and could get us back to historical average conditions for construction. This would in turn lead to a spectacular gain of near 4% GDP growth in 2018.”
Current-dollar GDP increased 5.0%, or $238.3 billion, in the fourth quarter to a level of $19,738.9 billion. In the third quarter, current-dollar GDP increased 5.3%, or $250.6 billion. The price index for gross domestic purchases increased 2.5% in the fourth quarter, compared with an increase of 1.7% in the third quarter (table 4). The PCE price index increased 2.8%, compared with an increase of 1.5%. Excluding food and energy prices, the PCE price index increased 1.9%, compared with an increase of 1.3% (appendix table A).
Current-dollar personal income increased $178.9 billion in the fourth quarter, compared with an increase of $112.3 billion in the third. The acceleration in personal income primarily reflected an upturn in personal interest income and an acceleration in nonfarm proprietors’ income.
Disposable personal income increased $139.0 billion, or 3.9%, in the fourth quarter, compared with an increase of $73.8 billion, or 2.1%, in the third. Real disposable personal income increased 1.1%, compared with an increase of 0.5%. Personal saving was $384.4 billion in the fourth quarter, compared with $478.3 billion in the third. The personal saving rate — personal saving as a%age of disposable personal income — was 2.6% in the fourth quarter, compared with 3.3% in the third. 2017 GDP Real GDP increased 2.3% in 2017 (that is, from the 2016 annual level to the 2017 annual level), compared with an increase of 1.5% in 2016.
The increase in real GDP in 2017 primarily reflected positive contributions from PCE, nonresidential fixed investment, and exports. Imports, which are a subtraction in the calculation of GDP, increased (table 2). The acceleration in real GDP from 2016 to 2017 reflected upturns in nonresidential fixed investment and in exports and a smaller decrease in private inventory investment. These movements were partly offset by decelerations in residential fixed investment and in state and local government spending. Imports, which are a subtraction in the calculation of GDP, accelerated.
Current-dollar GDP increased 4.1%, or $762.3 billion, in 2017 to a level of $19,386.8 billion, compared with an increase of 2.8%, or $503.8 billion, in 2016. The price index for gross domestic purchases increased 1.8% in 2017, compared with an increase of 1.0% in 2016.
The PCE price index increased 1.7%, compared with an increase of 1.2%. Excluding food and energy prices, the PCE price index increased 1.5%, compared with an increase of 1.8% (appendix table A). During 2017 (measured from the fourth quarter of 2016 to the fourth quarter of 2017), real GDP increased 2.5%, compared with an increase of 1.8% during 2016. The price index for gross domestic purchases increased 1.9% during 2017, compared with an increase of 1.4% during 2016 (table 7).
