Toll Brothers, Inc. (NYSE:TOL) after market close Tuesday reported net income of $56.9 million, or $0.41 per share diluted, for its first fiscal quarter ended January 31. The gain compared to FY 2019’s first quarter net income of $112.1 million, or $0.76 per share diluted. The gain missed the analyst consensus estimate of a gain of $0.46 per share.
Among the results:
• FY 2020’s first quarter pre-tax income was $65.9 million, compared to FY 2019’s first quarter pre-tax income of $151.4 million.
• FY 2020’s first quarter results included pre-tax inventory impairments totaling $1.0 million, compared to FY 2019’s first quarter pre-tax inventory impairments of $7.6 million.
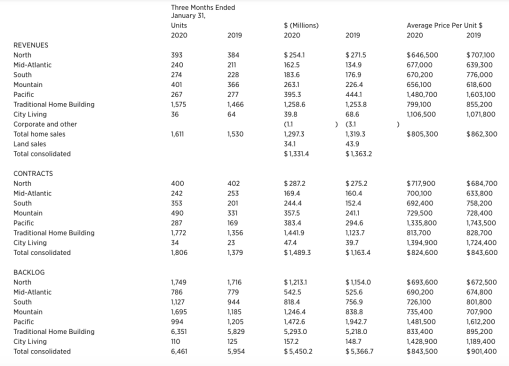
• FY 2020’s first quarter home sales revenues were $1.30 billion and 1,611 units, compared to FY 2019’s first quarter totals of $1.32 billion and 1,530 units.
• FY 2020’s first quarter net signed contracts were $1.49 billion and 1,806 units, compared to FY 2019’s first quarter net signed contracts of $1.16 billion and 1,379 units.
• FY 2020’s first quarter net signed contracts, on a per-community basis, were 5.6 units, compared to first quarter net signed contracts, on a per-community basis, of 4.4 units in FY 2019, 6.0 units in FY 2018, 4.7 in FY 2017 and 4.3 in FY 2016.
• In FY 2020, first quarter-end backlog was $5.45 billion and 6,461 units, compared to FY 2019’s first quarter-end backlog of $5.37 billion and 5,954 units. The average price of homes in backlog was $843,500, compared to $901,400 at FY 2019’s first-quarter end.
• FY 2020’s first quarter home sales gross margin was 18.3%, compared to FY 2019’s first quarter home sales gross margin of 21.0%.
• FY 2020’s first quarter Adjusted Home Sales Gross Margin was 20.9%, compared to FY 2019’s first quarter Adjusted Home Sales Gross Margin of 24.2%.
• FY 2020’s first quarter interest included in cost of sales was 2.5% of revenue, compared to 2.6% in FY 2019’s first quarter.
• FY 2020’s first quarter SG&A, as a percentage of home sales revenues, was 14.8%, compared to 12.3% in FY 2019’s first quarter.
• FY 2020’s first quarter income from operations of $47.5 million represented 3.6% of total revenues, compared to FY 2019’s first quarter of $124.4 million representing 9.1% of revenues.
• FY 2020’s first quarter other income, income from unconsolidated entities, and land sales gross profit totaled $20.2 million, compared to FY 2019’s first quarter total of $36.6 million.
• FY 2020’s first-quarter cancellation rate (current quarter cancellations divided by current quarter signed contracts) was 9.4%, compared to FY 2019’s first-quarter cancellation rate of 9.6%.
• FY 2020’s first-quarter cancellation rate as a percentage of beginning-quarter backlog was 3.0%, compared to FY 2019’s first-quarter cancellation rate as a percentage of beginning-quarter backlog of 2.4%.
• The company ended its FY 2020 first quarter with $519.8 million in cash and cash equivalents, compared to $1.29 billion at FYE 2019 and $801.7 million at FY 2019’s first-quarter end. At FY 2020 first-quarter end, the Company also had $1.59 billion available under its $1.905 billion bank revolving credit facility.
• During the first quarter of FY 2020, the company repurchased approximately 11.7 million shares at an average price per share of $40.73, for an aggregate purchase price of approximately $476.0 million, representing 8% of shares outstanding as of FYE 2019.
• On January 24, 2020, the company paid its quarterly dividend of $0.11 per share to shareholders of record at the close of business on January 10, 2020.
• Stockholders’ Equity at FY 2020 first-quarter end was $4.66 billion, compared to $5.07 billion at FY 2019’s fourth-quarter end.
• FY 2020’s first-quarter end book value per share was $35.87 per share, compared to $35.99 at FY 2019’s fourth-quarter end.
• The company ended its FY 2020 first quarter with a debt-to-capital ratio of 46.4%, compared to 43.6% at FY 2019’s fourth-quarter end and 42.7% at FY 2019’s first-quarter end. The company ended FY 2020’s first quarter with a net debt-to-capital ratio of 42.3%, compared to 32.9% at FY 2019’s fourth-quarter end, and 36.0% at FY 2019’s first-quarter end.
• The company ended FY 2020’s first quarter with approximately 62,000 lots owned and optioned, compared to 59,200 one quarter earlier, and 54,000 one year earlier. Approximately 37,100 of these lots were owned, of which approximately 17,200 lots, including those in backlog, were substantially improved.
• In the first quarter of FY 2020, the company spent approximately $178.9 million on land to purchase approximately 2,000 lots.
• The company ended FY 2020’s first quarter with 328 selling communities, compared to 333 at FY 2019’s fourth-quarter end and 317 at FY 2019’s first-quarter end.
• As previously announced, effective November 1, 2019, the company appointed James Boyd and Robert Parahus as executive vice presidents and co-chief operating officers to succeed Richard Hartman, who retired from the position of president and chief operating officer on the same date. Boyd now has oversight responsibility for the company’s western region and Parahus its eastern region. In connection with the succession of the chief operating officer role, the company made certain changes to its regional management structure. The company realigned certain of the states located among five home building regions as follows:
Eastern Region:
• The North region: Connecticut, Delaware, Illinois, Massachusetts, Michigan, Pennsylvania, New Jersey and New York;
• The Mid-Atlantic region: Georgia, Maryland, North Carolina, Tennessee and Virginia;
• The South region: Florida, South Carolina and Texas;
Western Region:
• The Mountain region: Arizona, Colorado, Idaho, Nevada and Utah; and
• The Pacific region: California, Oregon and Washington.
Previously, the Company’s home building regional segments were:
• North: Connecticut, Illinois, Massachusetts, Michigan, New Jersey and New York
• Mid-Atlantic: Delaware, Maryland, Pennsylvania and Virginia
• South: Florida, Georgia, North Carolina, South Carolina and Texas
• West: Arizona, Colorado, Idaho, Nevada, Oregon, Utah and Washington
• California: California
Douglas C. Yearley, Jr., Toll Brothers’ chairman and chief executive officer, stated: “Our first quarter contracts were up 31% in units and 28% in dollars, and our contracts per-community were up 28%, compared to one year ago. We saw improvement in California with contracts up 32% in units and 10% in dollars. Demand has remained strong through the start of our second quarter and we are experiencing pricing power in many of our markets.”
He continued, “Revenues were below guidance in our first quarter, as some deliveries slipped into our second quarter. Our guidance for deliveries for FY 2020 is between 8,600 and 9,100 homes, at an average price of between $800,000 and $820,000 per home. The adjusted gross margin in the first half of FY 2020 will continue to reflect the challenging sales environment we experienced through the third quarter of FY 2019. We expect our adjusted gross margin in FY 2020’s second half to improve by approximately 100 basis points over the first half, reflecting the improved selling environment that began in late FY 2019. The more recent growth in contracts and absorptions, increase in pricing power, and our projected 10% community count expansion should contribute to margin and earnings improvement in FY 2021.”
“We are committed to improving our return on equity through capital efficient land acquisitions, more quicker-turn affordable luxury communities, dividend payments, and share repurchases, Yearley said. “In the first quarter of FY 2020 we repurchased $476 million of stock at an average price of $40.73 per share, which reduced our share count by 11.7 million shares, or 8%, from FYE 2019. We expect share repurchases to remain a significant component of our capital allocation strategy. Importantly, our strong balance sheet allows us to both continue to repurchase shares and grow our business through land purchases and selective home builder acquisitions in promising markets, such as our recent purchases of Sharp Residential in Atlanta, Sabal Homes in South Carolina, and Thrive Residential in Atlanta and Nashville.”
He concluded, “Single-family permits rose in January to the highest seasonally adjusted annual pace since June 2007. Even so, housing supply remains tight. Interest rates remain historically low, consumer confidence is healthy, household formations are strong, and unemployment is at or near record lows. According to the January existing home sales report from the National Association of Realtors, the growth in existing home sales was strongest in the $500,000 to $750,000 price range. With this positive macro backdrop, market fundamentals remain supportive as we continue to expand our luxury brand to new price points, product lines, and geographies.”