
The first Friday of a month–whether or not it’s a Cinco de Mayo like today–gets added weight of importance in housing for its added freight of meaning in each new monthly “employment situation” report from the Bureau of Labor Statistics.
Today’s BLS top lines are that private and public sector employers added 211,000 new headcount positions to their organizations in the month of April, keeping relatively flat the national unemployment rate to 4.4%, and the labor force participation rate of .
Release of these figures, plotting a record 79 consecutive months of job growth, indicates a real impact at a household level for those who secure new employment, and this bubbles up to consumer spending and confidence alike.
This morning’s announcement–showing job gains in leisure and hospitality, health care and social assistance, financial activities, and mining–will true up with the current administration’s narrative of jobs and better income opportunities for many locations the latest economic and housing recoveries have skipped over.
Interestingly, Trulia economist Ralph McLaughlin has a deep dive analysis of “a tale of two recoveries” in his latest post, called “The Housing Recovery That Wasn’t.” One of the take-aways is that, as is so often the case for residential real estate data, national broad-strokes trends contrast massively with local, granular realities.
And another phenomenon to keep in mind is that, even within “market” localities, sub-markets, and sub-sub-markets can behave profoundly different from one another.
What McLaughlin’s analysis does beautifully here is to point up the “spotty” nature of economic and housing recovery, geographically favoring some places while completely neglecting others.
There’re two important underlying meanings here for residential investment, development, and home building land and business strategists. One is that American housing’s “hot markets” are hot for particular reasons and in particular ways, as McLaughlin notes, and we’ll get into that in a moment.
The other important take-away is that what looks like a “red flag” warning to many can signal “green flag” big opportunity for others. For some developers and builders, a next stretch of growth will focus on taking volume and share gains from those markets, submarkets, and sub-submarkets that have already shone bright as overachievers during the first phases of the recovery.
Exceptional developers and builders will look at McLaughlin’s “red zones,” the geographical areas thus-far unresponsive to the broader, national recovery trends, and see both unmet need and out-sized opportunity.
Now, in light of the jobs data out today, the lenses McLaughlin advises us to look through do not include the base jobs growth number. Which is not to say that absolute employment growth does not matter. McLaughlin explains:
The lack of significant correlation is likely for two reasons: (1) job growth by itself doesn’t necessarily mean that households can bid more for a house unless that growth is correlated with increasing incomes, and (2) if job growth is indeed correlated with income growth, we included a measure of income growth in our model that would capture the effect.
So, it’s income growth, population growth, and vacancy rate data that materially impact housing’s “hottest markets” in a direct way.
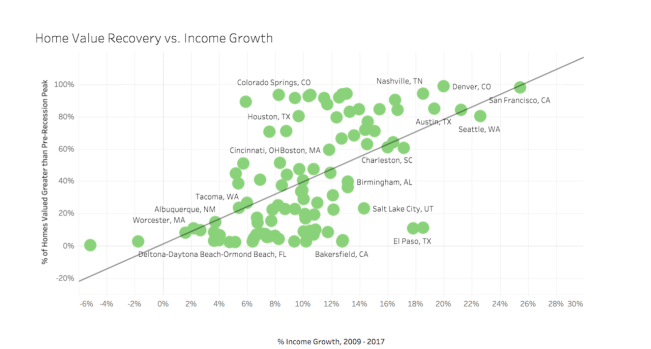
Source: Trulia "The Housing Recovery That Wasn't," by Ralph McLaughlin
As for income growth and both the pronounced spotty (geographically) and lumpy (industry to industry) characteristics of this recovery, Wall Street Journal staffer Eric Morath points to this question about a broadening of the bounty among more workers, in more areas of the country, across more industry sectors in an analytical passage here entitled “Wage Watch:”
Average hourly earnings for private-sector workers rose 2.7% from a year earlier in March, staying near the postrecession high set in December. A further acceleration in wages could provide a test of whether pay has increased to the point Americans on the sidelines are willing to re-enter the labor force.
So, we’ll stay particularly tuned to what’s going on–market-by-market with income trends, matched up as they are with the economy’s sub-sectors.
And for that point of focus, we’re fascinating with the data LinkedIn can pull out of its subscriber audience data-base detailing not only what the action is on an industry-by-industry basis, but what the implications of those trends are for geographical areas. Going back to McLaughlin’s note that both income growth and population/household growth are strong proxies to housing market recovery, we’re intrigued by this analysis from LinkedIn’s “Workforce Report” for May 2017.
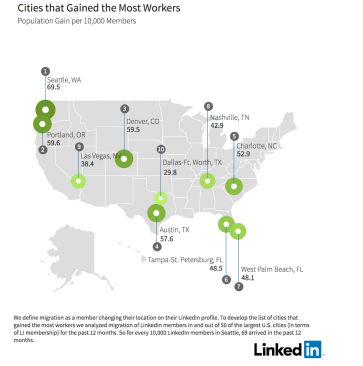
Cities that gained the most workers
Cities that are gaining workers tend to have stronger economies than cities that are losing workers. We noticed that the cities that are gaining the most workers primarily attract talent from across the U.S. and internationally. For example, Seattle – where hiring was 17.9% higher in April than April 2016 – gains workers from New York, Los Angeles, Bangalore, and London.
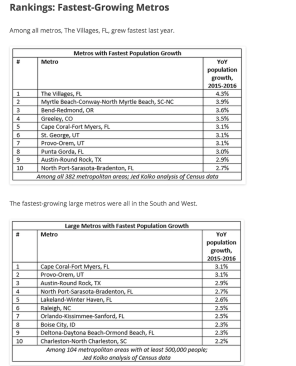
Here, work from geographically and demographically enlightened economist Jed Kolko corroborates LinkedIn user data. Kolko highlights America’s fastest growing metros in two charts here:
Finally, and we’ll give you a tiny glimpse at this one for free: hot markets are not for everybody.
The thing about a hot market is that everybody knows about a hot market and everybody who’s selling land in a hot market knows it too. This makes land very expensive, which increases the risk, thins the margins, and collapses the margin of error in those markets.
One with an exclusive, highly sharpened insight into how hot market behavior can diminish opportunity for some players, while other players can more nimbly counter-program and counter-navigate a hot market is Reach Advisors founder and principal James Chung.
James, we’re happy to say, is keynoting our opening session at next week’s Housing Leadership Summit, with a presentation entitled, “The Geography of What’s Next,” which maps to how builders can differentiate product, pricing, and costs by using data.
Happy Cinco de Mayo! See you there.