Based on signed contracts, year-over-year statewide pending home sales in Calfornia fell in August on a seasonally adjusted basis, with the Pending Home Sales Index (PHSI)* declining 3.5% from 121.3 in August 2016 to 117.0 in August 2017, the California Assocation of Realtors reported Tuesday. California pending home sales also declined down on a monthly basis, decreasing 2.0% from the July index of 119.4.
The group said pending home sales have declined on an annual basis for seven of the last eight months so far this year. After a solid run-up of pending sales growth in April, May, and July, continued housing inventory issues and affordability constraints may have pushed the market to a tipping point, suggesting the pace of growth will begin to slow in the fall.
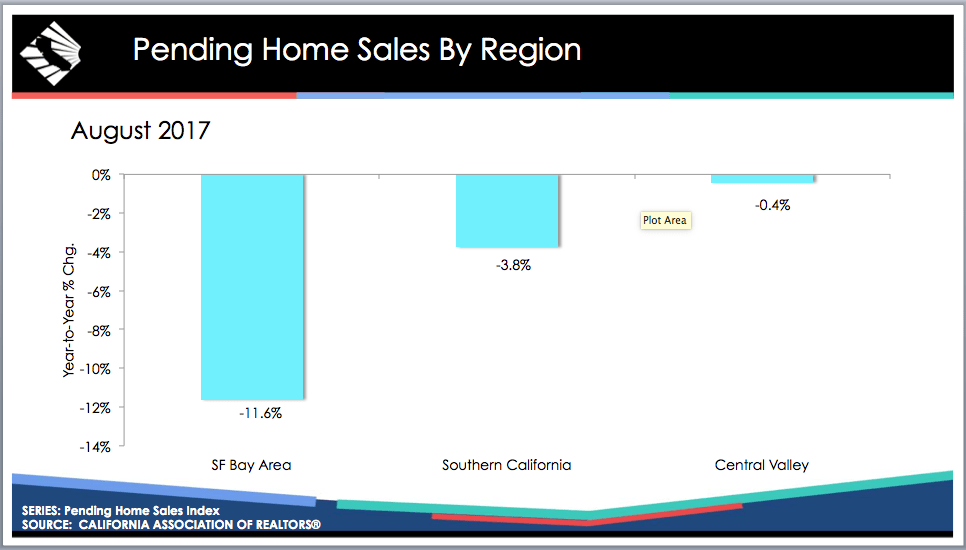
All major regions recorded a decrease in pending sales from the previous year, with the San Francisco Bay Area experiencing the largest drop in pending sales, falling 11.6% on an annual basis. San Francisco, San Mateo, Santa Clara and Monterey counties were all down in double-digits of 11.8%, 14.0%, 13.4%, and 12.5%, respectively.
Pending home sales were down 3.8% from the previous year in Southern California. Only Orange (1.8%) and San Bernardino (2.8%) counties posted a year-to-year increase. Los Angeles, Riverside, and San Diego counties registered lower annual pending sales of 1.7%, 10.3%, and 12.7%, respectively.
Pending sales in the Central Valley dipped 0.4% from the previous year, led by a 13.9% annual decrease in Sacramento County, while Kern County recorded a 13.4% decrease from last August.
C.A.R.’s Market Velocity Index – home sales relative to the number of new listings coming on line each month to replenish that sold inventory, or market indicator of future price appreciation – indicates that home prices should continue to stay strong as home sales continue to outstrip new listings, putting upward pressure on home prices through the fall. The Market Velocity Index increased from 59 to 69, indicating that there were 69 percent more homes sold than there were new listings. In other words, the supply of homes available for sale continued to drop, which will make the remaining units more competitive as net supply has deteriorated by roughly 45,000 units this year.