Pending home sales in California fell for the third consecutive month in September, suggesting that the housing market will slow as the end of the year winds down, the CALIFORNIA ASSOCIATION OF REALTORS® (C.A.R.) said Tuesday.
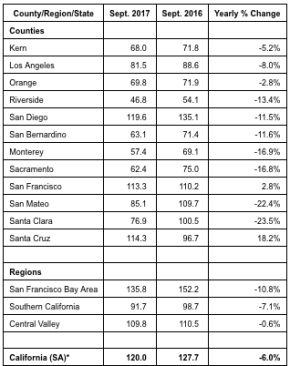
Based on signed contracts, year-over-year statewide pending home sales dropped in September on a seasonally adjusted basis, with the Pending Home Sales Index (PHSI)* declining 6.0% from 127.7 in September 2016 to 120.0 in September 2017. California pending home sales increased on a monthly basis, rising 2.5% from the August index of 117.0.
Pending home sales have declined on an annual basis for eight of the last nine months so far this year. After a solid run-up of closed sales in May, June, and August, continued housing inventory issues and affordability constraints may have pushed the market to a tipping point, suggesting the pace of growth will begin to slow in the fall.
All of the major regions recorded a decrease in pending sales from the previous year, with the San Francisco Bay Area experiencing the largest drop in pending sales, falling 10.8% on an annual basis. San Mateo, Santa Clara and Monterey counties were all down in double-digits of 22.4%, 23.5%, 16.9%, respectively. Pending sales in San Francisco County inched up 2.8%.
Pending home sales were down 7.1% from the previous year in Southern California. Los Angeles, Riverside, and San Diego counties registered lower annual pending sales of 8.0%, 13.4%, and 11.5%, respectively. Orange County experienced its first year-to-year pending sales decrease (2.8%) in six months, and San Bernardino County posted its first annual decline (11.6%) in four months.
The Central Valley region experienced a nominal 0.6% annual pending sales decline, led by a 16.8% annual decrease in Sacramento County, while Kern County recorded a 5.2% decrease from last September.
C.A.R.’s Market Velocity Index – home sales relative to the number of new listings coming on line each month to replenish that sold inventory, or market indicator of future price appreciation – suggests that there continues to be upward pressure on home prices through the fall. Home sales continue to outstrip new listings coming online to restock sold units. The Market Velocity Index dipped from 53 to 52, implying that there were 52% more homes sold than new listings, meaning the supply of homes available for sale continued to drop.