Many custom builders get a balance sheet for review at the end of each month from their accounting system. I find, however, that very few of them use this report as a tool to analyze their companies’ financial results.
A balance sheet is simply a snapshot of a business’s financial condition at a specific moment in time, usually at the close of an accounting period. A balance sheet comprises assets, liabilities, and owners’ or stockholders’ equity. Assets and liabilities are divided into short-and long-term obligations including cash accounts such as checking, money market, or government securities. At any given time, assets must equal liabilities plus owners’ equity.
This statement is also referred to as a statement of financial position or a statement of financial condition. The balance sheet presents net balances at the end of an accounting period, rather than the total transactions for the period presented in the income statement. The balance sheet allows the custom builder to know how much cash he has in the bank, how much money he is owed, what equipment is on hand, and so on, at a given period of time.
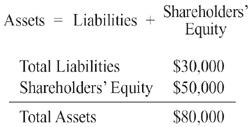
The concept behind the balance sheet is very simple. In order to acquire assets, a firm must pay for them with either debt (liabilities) or with the owners’ capital (shareholders’ equity). Therefore, the following equation must hold true:
Assets are what the firm has, and liabilities are what the firm owes. The difference between the two is equity or the firm’s worth. For example, if the firm’s assets are $1 million and its liabilities are $600,000, its equity is $400,000. Assets minus liabilities equal equity. Or, looked at another way, assets equal liabilities plus equity. The balance sheet is typically written in this latter form, with assets listed on the left and liabilities plus equity listed on the right. The columns are totaled at the bottom. As the name implies, the balance sheet’s bottom lines must always balance. In other words, the total assets are equal to total liabilities plus net worth. Particular items in a balance sheet may vary significantly from day to day. Over time, though, these “snapshots” of a company taken on a yearly or monthly basis, can reveal important information about the ability of the company to satisfy its creditors, manage inventory, and collect its receivables.
Proper analysis of a balance sheet will help you understand and evaluate your financial strength, liquidity, and leverage. It will also provide information that will help you formulate and monitor company goals and plans. A balance sheet helps you quickly get a handle on the financial strength and capabilities of your business: Is the business in a position to expand? Can the business easily handle the normal financial ebb and flow of revenue and expenses? Should the business take immediate steps to bolster cash reserves?
Analyzing the balance sheet also provides information on changes in the financial structure of your company. Observing changes and identifying trends helps to identify what good and bad things are happening to it. Trends are more useful than numbers. They provide the knowledge, first, to see if there is a trend; second, to determine whether the trend is good or bad; and third, to take appropriate action.
Doctors use their education, experience, and—occasionally—some inspiration to diagnose the physical health of a patient. A doctor typically runs through a series of tests and compares the test results with the patient’s condition before the tests, rather than merely concentrating on the test results. The doctor is looking for good and bad trends. The subsequent analysis will identify what the patient might do to bolster the good trends and reduce the bad ones. Balance sheet analysis similarly looks at the financial health of a firm. The analysis runs the business through a series of tests and needs more than one number to show the complete picture.
Many accounting systems compare the current month balances to the same period in the prior year. While this may be good for companies in other industries, I believe that it really doesn’t provide much of a basis for analysis to builders. The best way for a custom builder to look at his balance sheet is to compare the balances of the current month with the prior month’s balances. This information should be shown on your balance sheet plus a column that reflects the change between the periods. Comparing balances between the end of the current month and the prior month lets you see the changes that have occurred in assets, liabilities, and equity during the month. In order to truly gain a handle on the balance sheet, it is important for custom builders to report financial results on a percentage-of-completion basis, reflecting underbillings and overbillings on the balance sheet.
By using the balance sheet to analyze liquidity, a custom builder should be able to answer such questions as, “What are the company’s sources and uses of cash?” “How much working capital does the company have and how much does it need?” “Should the company take steps to bolster cash reserves?”
Liquidity is the ability of the firm to meet debts when they become due. This means that the firm must have sufficient cash to meet current liabilities. These liabilities include accounts payable, operating loans, and the current portion of notes and mortgages. The cash to pay these debts comes from current assets, which include items such as cash, cash equivalents, inventory, and receivables. There must be enough of these, as cash, to pay the bills. If there is, the firm is liquid. If there is insufficient cash, the firm is illiquid and must raise cash by selling assets or borrowing to meet the current liabilities. Working capital is a useful liquidity tool. It is determined by subtracting current liabilities from current assets. Quick working capital looks at working capital more critically. Its concept is that some current assets are not as liquid as other assets. Nothing is as liquid as cash, but liquid current assets also include items that can be sold quickly without a discount. You can compute quick working capital by subtracting inventory and current liabilities from current assets.
Liquidity can also be analyzed using two important ratios. The current ratio is the most popular measure of a company’s solvency. It compares the amount of current assets with which payments can be made to the amount of current liabilities requiring payment. The higher the ratio, the more able the company is to meet its current obligations. A ratio of 1.3, meaning the firm has $1.30 of current assets for every dollar of current liability, is often considered the ideal. A ratio below 1.0 or a downward trend from 1.3 can be an indication of potential cash flow problems, while a ratio above 1.6 can indicate reluctance to fully utilize your credit position.
For custom builders involved in spec homes, another important liquidity ratio is the quick ratio. The quick ratio is simply current assets minus inventories divided by current liabilities. By taking work in progress (inventories) out of the equation, you can see if your company has sufficient liquid assets to meet short-term operating needs.
Analysis of leverage can help determine how much of the company’s money an owner should use compared with how much of other people’s money (debt). The debt-to-equity ratio is a key measure of the company’s leverage factor. Banks strongly rely on this ratio to evaluate a company’s creditworthiness. The higher the ratio, the greater the risk creditors assume. Custom builders with a high debt-to-equity ratio may have trouble getting construction loans; and if they get loans, they’ll probably be paying higher rates than builders who aren’t so highly leveraged. Conversely, a lower ratio usually indicates that the company has more borrowing capacity and greater long-term financial stability. A debt-to-equity ratio of 4:1 means that the company is using $4 of other people’s money (debt) for every dollar of owners’ equity the company is using.
Next month when you review your financial results, take the time to analyze your assets, liabilities, and equity using these tools and watch for trends in your company’s liquidity and leverage. You should gain a new insight into your company’s health.
Steve Maltzman, CPA, is president of Steve Maltzman and Associates in Colton, Calif. Visit him at www.smacfo.com.