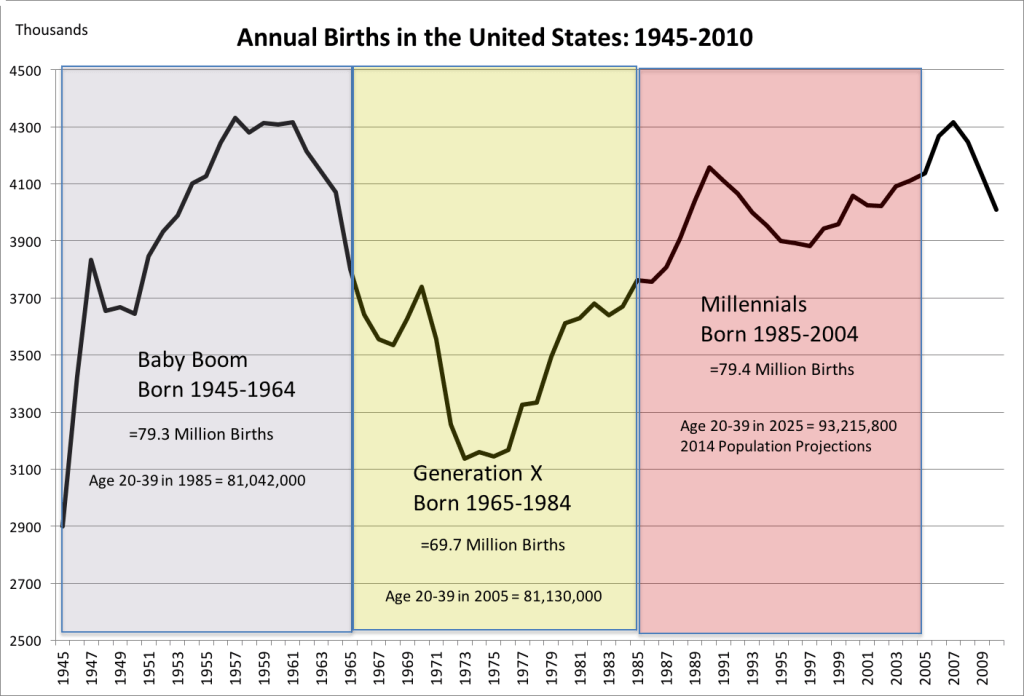
Those darn ’70s: Love, peace, and rock ‘n’ roll—and a lot fewer babies. A picture says a thousand words, and this particular picture tells many stories.
This graph illustrates the number of U.S. live births by year, from 1945 to 2005. The baby boom can clearly be seen as the “mountain” on the left. There was a significant drop in births in the ’70s, followed by the echo boom illustrated on the right.
Looking back, it’s interesting to plug in historical events on a timeline that correlate to the age that people would have been at the time there was a rise or drop in those events.
In 1980, Chicago’s then-Mayor Jane Byrne proposed closing 65 public schools due to the decline in K-12 enrollment that she attributed to families moving out to the suburbs. Looking back at history, we now know that public school enrollment declined nationwide in the ’80s. However, elementary schools that were closed, sold, demolished, or otherwise repurposed nationwide had to be rebuilt again in the 1990s because the birth rate increased in the early 80s and suddenly the kids were back.
Public school enrollment declined in the ’80s, then rose again. Unemployment plummeted in the ’90s, then rose again. Auto sales fell in the ’90s, then rose again. Crime dropped and is now rising again. Home sales fell and are now rising again.
By and large, people don’t change. It’s the number of people in a segment that changes the rate at which a certain industry will be affected, and that number can be projected by knowing the age of the “customer” and analyzing birth rates.
People go to elementary school, then high school, then either on to college or enter the job market. People in their 20s buy cars; people in their 30s buy their first homes. They then sell those homes to trade up or build in their 40s and 50s, and sell to downsize or retire in their 60s and 70s.
The juggling act of addressing imbalances within the same industry is where it gets tricky. When looking at the housing market, this imbalance becomes crystal clear by looking at the above chart. Those on the far left, the oldest baby boomers, are preparing for retirement and are sellers. In the middle of that mountain are the repeat trade-up buyers who are also sellers.
Toward the downslope and into the valley are first-time trade-up buyers. This smaller group, born in the ’70s, were the shortage of first-time buyers from the crisis and are now the shortage of first-time sellers. They need to sell before they can trade-up, and their housing is most appealing to today’s first-time buyers. But because this is a smaller group, it creates a shortage of this level of inventory available to first-time buyers.
The right side of the chart shows the pool of potential first-time buyers. They’re out there, they’re just not old enough yet, and they are far outnumbered by sellers in a variety of stages. First-time buyers average 33 years old, and there’s simply not enough of them yet, relative to the number of sellers that are counting on them. They’re coming, but will they get here at rates fast enough? The answer to that is probably not, unless a strategy is implemented.
Today’s market conditions reflect a combination of 1) a reduction of first-time buyers due to their age, their numbers, and their challenges; 2) a shortage of first-time trade-up-buyers due to low births in the ’70s; 3) a mountain of potential sellers counting on the first two segments to get the engine going, and 4) builders lying in wait for what should be a parade of trade-up buyers.
The housing market needs a two-fold strategy to increase the number of first-time buyers coming into the market and to increase the absorption rate realized by first-time buyer activity. This is achievable by addressing financial constraints holding first-time buyers back; and implementing an incentive for first-time buyers to buy from an owner occupant to drive others up the ladder.
Together, we can develop solutions to this problem for the housing industry. Join us as part of the thought process at HIVE.


