
Guest commentator on Bill McBride’s Calculated Risk blog, housing economics guru Thomas Lawler, compares and contrasts big public builder performance in the third quarter of 2016 with Census Bureau estimates of new home sales (single-family) for Q3.
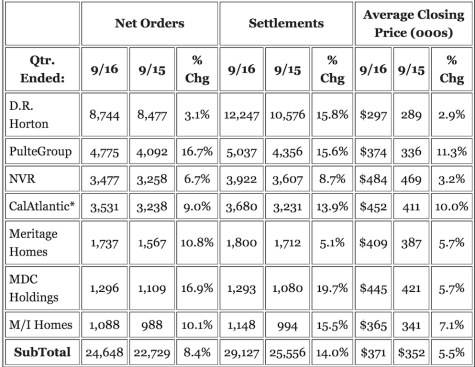
Lawler’s bucket of seven builders in total reported 24,648 new orders in the quarter ended Sept. 30, an 8.4% increase over the same period in 2015. At the same time, the Census estimated total national new home sales of 147,000, a 23.5% jump from prior year. Why the big spread in growth rates, especially when public builders’ share of total new residential construction is in the 45% range?
Setting aside accounting and reporting differences, Lawler’s guess–upon looking at the big difference between the modest order growth among the seven national publics and the Census’s new-home sales estimate–is that the Census is wrong, and that a downward revision is coming. His take-away from the comparison is this:
The latest quarterly results of these large builders shows unusually slow growth relative to the growth in Census’ estimate of new SF home sales. Given that preliminary Census home sales estimates are often revised significantly, in part because Census must “guesstimate” sales of homes for which a permit has not yet been issued, I believe there is a better-than-even change that third-quarter new home sales as estimate by the Census Bureau will be revised downward in the next monthly release.
Lawler’s been doing this a long time, and it would go against better judgment to dismiss his conclusion, which calls for a lowered revision to Q3 Census data on new home single-family sales. Lawler looks at the two data sets–the builders’ reports and the Census bureau’s scarcely reliable estimates–and chooses to view the builders as a better proxy for reality. We don’t argue that point at all. Still, something else may be afoot, and it may have implications for what builders may do or might need to do to course-correct for the next stretch of the housing cycle.
With permission from Calculated Risk, Bill McBride
Look at the seven-company public builder third-quarter data set one more time, and what strikes you?
For me, it’s the columns under “Average Closing Price (000s).” The big publics in this group saw average closing prices clock in at $371,000, a 5.5% increase over prices during the same period for the same builders in 2015. Four builders from among this group averaged over $400,000 for their Q3 closings.
The observation is this. Thanks to the market concentration of the publics–most of them compete head-to-head with two or three or four or even five other publics in the same geographical markets and submarkets–they’re probably driving their own prices higher by competing for the same lots, labor, and management talent in the concentrated geographical arena.
So, while the big national publics are subject to higher input costs, land costs, labor costs, and talent costs on the ground in their respective, very finite operating footprints, other nimbler, smaller builders in other markets are able to produce homes at prices those markets can better tolerate based on their means and access to mortgage credit.
Both vertical construction lending and home mortgage credit access loosened slightly during the first have of 2016, which eased a couple of housing’s noteworthy progress dampeners. While smaller, private home builders whose models are set up to meet the need for lower priced have been able to jumpstart into action, the big builders have been challenged to shift operational focus from higher-margin move-up and second-time-move-up programs into bread-and-butter entry-level initiatives.
As much as we don’t doubt that Lawler’s probably right to say the Census will lower its estimates for new home sales in Q3, we also think that the geographical dispersion of those sales–beyond the radars and operating spheres of the big publics–is probably more significant than it had been a year earlier.
The implications, of course, is that those nimble privates in markets outside the current operating footprint of most of the publics–in Alabama, in Boise, in the Northwest, perhaps, and others–may start to look like the “belle of the ball” to volume-hungry, entry-level platform-seeking acquisitive types.
It’s Nov. 9th, and at least one of America’s most profound and bedeviling questions of the past 18 months or so now has its answer. With that resolution come more questions, particularly as regards interest rates, global capital flow, and job formation trends. We’re guessing that by calendar year-end, we’ll be seeing more deals come to fruition as the shape of Amer-exit comes clear.