Florida’s new-home market has been surprisingly resilient in coming out of the downturn. Despite massive numbers of foreclosure homes for sale all around the state, builders have managed to find increasing numbers of buyers, and starts activity has rebounded nicely. Prices moved up rapidly in 2011, 2012, and 2013, rising at a more moderate pace in 2014.
Florida Market-by-Market
Tampa:
The Tampa market continues its slow recovery from the devastating recession. Home starts fell by 85% from the peak to the bottom. While some broad based indicators remain positive, like job growth and the local unemployment rate, they have not resulted in robust demand for new housing. As of mid-2014, the Tampa annual pace for new housing starts was 5,853 units.
While this was a 69% improvement from the 3,462 homes built in 2009, it represents just 26% of the peak starts (22,409 units for the twelve months ending March 31, 2006). Families that lost their homes by foreclosure, have difficulty in qualifying for a mortgage or can’t afford the rising new home prices have driven a greater portion of housing demand into rental apartments.
Tampa |
|
Closings | Average Price |
$/SF |
| 2Q13 | 1,510 | $241,924 | $102.29 |
| 3Q13 | 1,484 | $251,058 | $104.96 |
| 4Q13 | 1,642 | $264,895 | $107.68 |
| 1Q14 | 1,108 | $272,419 | $106.33 |
| 2Q14 | 1,304 | $276,138 | $106.82 |
Over the last year, single family detached home prices are up 12.7% for the five county Tampa market. Homes that closed during the second quarter of 2014 had an average price of $288,006 versus $255,491 in 2Q13. Not only are prices rising, but the average home size is growing. The 2Q closing records showed the average detached single-family home was 2,738. SF, up 227 SF over the 2Q13 average of 2,511 SF. During the second quarter of 2014, both home size and price were essentially flat.
We have seen prices also rise substantially over the last year in townhome and villa product. The average closing price in 2Q14 was $210,243 or 11.9% higher than the $187,881 average in 2Q13. Unlike the detached product, the average size of attached product is shrinking.
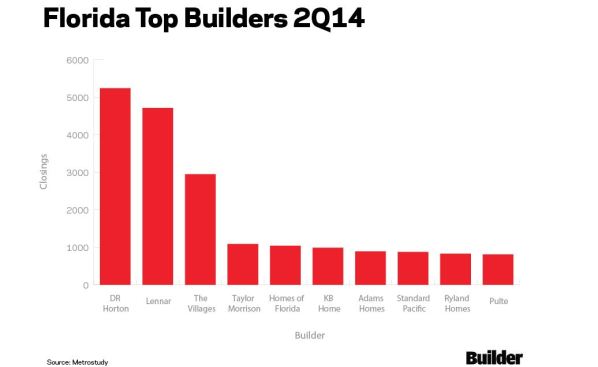
Tampa is a highly concentrated new home market as the Top 10 builders accounted for 60% of all annual housing starts in the second quarter of 2014. The list of top builders includes nine national builders and just one local builder. Lennar Homes dominates the list and built more homes than builders #2, 3 and 4 combined.
Tampa
August 1, 2013 – July 31, 2014
Builder | Closings |
Lennar Homes | 1,100 |
DR Horton | 409 |
Pulte Group | 343 |
M/I Homes | 314 |
Taylor Morrison | 280 |
Homes by WestBay | 262 |
Standard Pacific Homes | 235 |
Beazer Homes | 213 |
Ryland Homes | 189 |
K. Hovnanian | 185 |
TOTAL | 3,530 |
Sarasota:
The Sarasota market is less reliant upon job growth to create housing demand as the market has a strong reputation for retiree demand. That did not mean that Sarasota was immune to the recession. New home starts fell by 86% from 9,113 for the twelve months ending March 31, 2006 to 1,284 units built in 2009. Sarasota has recovered quicker than other Florida markets and as of June 30, 2014, the annual start pace was 3,839 homes (up 199% from the cyclical low). As the recovery has taken hold, new home prices are rising. In fact, single-family detached homes sold for an average of $310,266 during 2Q14. This was a 22.5% increase over the $253,285 average price in 2Q13. A portion of the price increase was directly attributable to larger homes being bought. The average new home was 2,368 SF in 2Q14 versus 2,076 SF in 2Q13. Buyers are looking for a fourth bedroom or home office particularly in Manatee County.
Sarasota |
|
Closings | Average Price |
$/SF |
| 2Q13 | 707 | $247,643 | $123.57 |
| 3Q13 | 827 | $259,779 | $126.41 |
| 4Q13 | 937 | $284,759 | $131.04 |
| 1Q14 | 677 | $248,670 | $130.09 |
| 2Q14 | 637 | $295,825 | $130.49 |
For townhome and villa product, prices have not changed over the last twelve months. The average closing price in 2Q14 was $224,293 or just 0.9% higher than the $222,364 average in 2Q13.The data does show that the average size of attached product grew to 1,765 SF. For the prior four quarters the average product size was between 1,597 and 1,680 SF.
Sarasota is a very highly concentrated new home market as the Top 10 builders accounted for 72% of all annual housing starts in 2Q14. The list includes seven national builders and three local/regional builders. The list is led by Neal Communities with 627 recorded closings, over one and a half time larger than #2 Pulte Group.
Sarasota
August 1, 2013 – July 31, 2014
Builder | Closings |
Neal Communities | 627 |
Pulte Group | 401 |
Lennar Homes | 374 |
DR Horton | 355 |
Taylor Morrison | 349 |
Ryland Homes | 211 |
WCI Communities | 175 |
Medallion Homes | 116 |
Maronda Homes | 109 |
M/I Homes | 72 |
TOTAL | 2,789 |
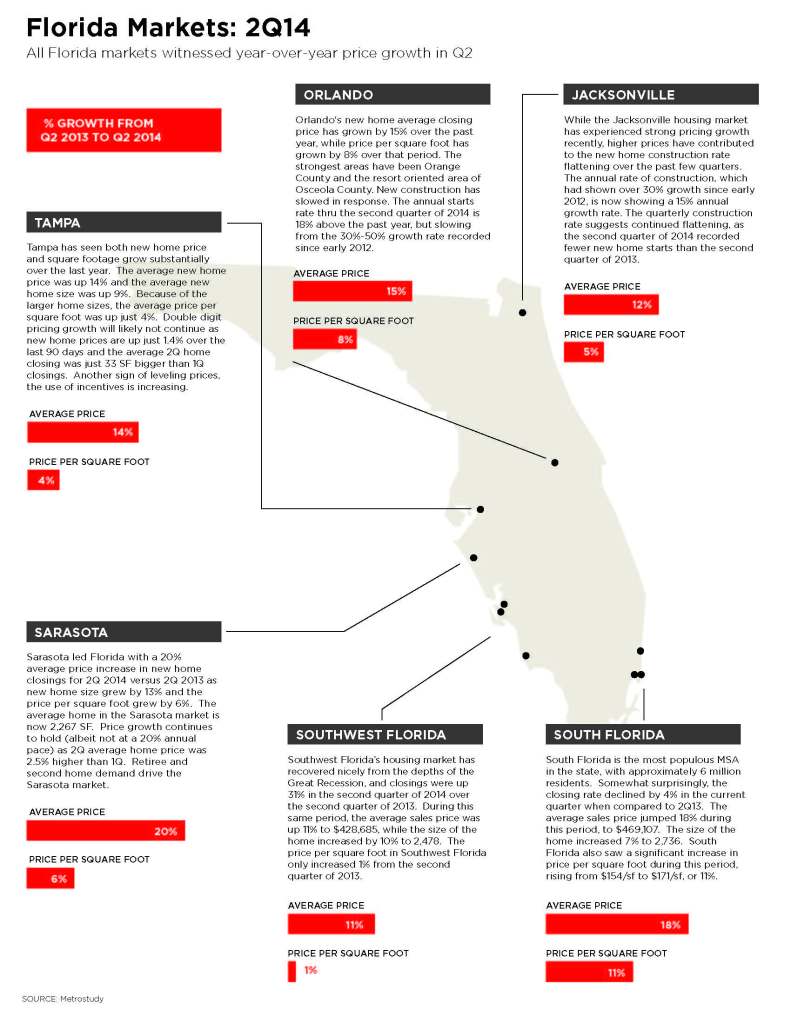
Southwest Florida:
Southwest Florida’s housing market has recovered nicely from the depths of the Great Recession, and closings were up 31% in 2Q14 over 2Q13. In fact, Metrostudy ranked the Cape Coral Ft. Myers MSA third and the Naples – Marco Island MSA sixth in last month’s “Top Ten Outlook and Market Health Ranking.”
SW Florida |
|
Closings | Average Price |
$/SF |
| 2Q13 | 611 | $384,869 | $171.12 |
| 3Q13 | 725 | $390,281 | $177.32 |
| 4Q13 | 891 | $429,191 | $188.42 |
| 1Q14 | 728 | $434,339 | $185.36 |
| 2Q14 | 800 | $428,685 | $173.00 |
During this same period, the average sales price was up 11%, and the size of the home increased by 10%. In particular, Naples showed a significant jump in pricing and home size, with a $75,000 average increase in pricing, to an average of $543,307, and an over 400 square foot increase (19%) in home size, to an average of 2,744. However, the price per square foot in Southwest Florida only increased 1% from 2Q13. This may be an anomaly for the current quarter, as price per square foot prices had risen from an average of $171/sf in 2Q13 to over $185/sf in 1Q14. It may reflect a developing trend with builders offering larger homes to offset the increase in sales prices. Metrostudy will monitor this metric to see if a trend emerges one way or the other.
Cape Coral-Ft Myers, Naples-Imokalee-Marco Island
August 1, 2013 – July 31, 2014
Builder | Closings |
Lennar | 943 |
Pulte-Del Webb-Centex | 401 |
DR Horton | 374 |
Stock development LLC | 355 |
WCI communities | 349 |
Gl Homes | 251 |
Taylor Morrison | 175 |
Habitat for Humanity | 116 |
Toll Brothers | 109 |
Minto Builders | 72 |
TOTAL | 3,145 |
The Treasure Coast:
As with Southwest Florida, the Treasure Coast has seen a big recovery from the lows of the market back in 2010, and closings are up 36% the second quarter this year over the 2Q13. Home prices are among the most affordable in South Florida. However, prices continue to rise, with the average up 16% to $294,131. The average size of the home increased from 2,285 to 2,443, a 7% jump. Pricing per square foot is the lowest of all three areas, and at only $120/sf, represents a true bargain for South Florida home shoppers. It’s still relatively easy to find a new single family detached home selling for under $200,000 on the Treasure Coast. Nevertheless, the price per square foot increased 8% during this period, so the trend is moving upward.
Treasure Coast |
|
Closings | Average Price |
$/SF |
| 2Q13 | 190 | $253,921 | $111.12 |
| 3Q13 | 223 | $283,141 | $115.23 |
| 4Q13 | 259 | $294,108 | $116.20 |
| 1Q14 | 208 | $288,007 | $116.22 |
| 2Q14 | 258 | $294,131 | $120.38 |
Sebastian-Vero Beach, Port St. Lucie
August 1, 2013 – July 31, 2014
Builder | Closings |
DR Horton | 280 |
Kolter Communities Florida LLC | 199 |
Adams Homes | 126 |
AV Homes, Inc. | 96 |
GHO Homes | 82 |
Pulte-Del Webb-Centex | 60 |
Maronda Homes | 59 |
Minto Builders | 59 |
KB Homes | 45 |
Habitat For Humanity | 32 |
TOTAL | 1,038 |
Miami- Ft.
Lauderdale:
South Florida is the most populous area with approximately 6 million residents. The Miami – Ft. Lauderdale MSA also placed in our Top Ten Ranking at ninth overall.
Miami-Ft. Lauderdale |
|
Closings | Average Price |
$/SF |
| 2Q13 | 1,033 | $296,665 | $154.40 |
| 3Q13 | 1,256 | $377,697 | $147.25 |
| 4Q13 | 1,331 | $417,954 | $154.28 |
| 1Q14 | 988 | $425,785 | $161.90 |
| 2Q14 | 994 | $469,107 | $171.46 |
Somewhat surprisingly, the closing rate declined by 4% in the current quarter when compared to 2Q13.This is also reflected in the annualized starts rate, which declined in 2Q14 as well. We are seeing the effects of a slight tempering in demand due to the relatively high sales prices and supply constraints caused by lot and labor shortages, which are noticeable in all three of the MSA’s counties.
Those price increases are on par with Naples, with a similar $75,000 jump in the average sales price, to $469,107. The increase in home size was more modest, at only 7% to 2,736. However, the overall size is one of the largest home sizes in all of South Florida; quite similar to Naples. South Florida also saw the largest increase in price per square foot during this period, rising from $154/sf to $171/sf, or 11%.
To summarize, prices continue to rise, although at a more modest pace, particularly in the past couple of quarters. Homes are getting bigger again, and we are likely to set another record for new home size in 2014. While home appreciation is likely to continue, there’s always the concern that higher prices will crimp demand. Supply constraints, especially in South Florida, might mask a muting in demand, but the other two areas could feel the pinch should prices rise beyond what consumers deem as reasonable.
Miami-Fort Lauderdale-West Palm Beach
August 1, 2013 – July 31, 2014
Builder | Closings |
Lennar | 1,450 |
Gl Homes | 630 |
DR Horton | 397 |
CC Devco Homes | 316 |
Standard Pacific Homes | 304 |
Pulte-Del Webb-Centex | 265 |
Encore Homebuilders | 240 |
Minto Builders | 226 |
Toll Brothers | 219 |
Terra Group | 143 |
| TOTAL |
Jacksonville:
The Jacksonville MSA’s new home average closing price has grown by almost $35,000, or 14% in the 2Q14 when compared to the second quarter of 2013. The price per square foot has grown by almost $8, or just over 7% during that same period.
Jacksonville |
|
Closings | Average Price |
$/SF |
| 2Q13 | 1,122 | $249,530 | $102.12 |
| 3Q13 | 1,143 | $259,474 | $103.23 |
| 4Q13 | 1,184 | $255,260 | $104.84 |
| 1Q14 | 1,165 | $272,197 | $106.74 |
| 2Q14 | 1,297 | $284,114 | $109.67 |
Even with this pricing growth the market’s quarterly closing rate increased by over 15% in 2Q14 when compared to 2Q13. New home starts (not shown here) have been flat over the past 6 quarters. Starts grew from under 600 units in the 4Q11, to 1,400 units in 2Q13, but have stayed between 1,300 and 1,400 units per quarter since.
This indicates the market has reached a point where pricing growth has curbed demand. With the strongest market areas being in northern St. Johns County, it is likely the demand for lower priced housing will push demand out of the urban core. We expect to see stronger growth in new housing construction further south in St. Johns county, as well as in Clay and northern and western Duval County over the coming quarters.
Jacksonville
August 1, 2013 – July 31, 2014
Builder | Closings |
DR Horton | 1,046 |
Dream Finders Homes LLC (Fl) | 384 |
Lennar | 373 |
Pulte-Del Webb-Centex | 317 |
Kb Home | 292 |
Richmond American Homes-MDC | 281 |
Mattamy Homes | 251 |
David Weekley Homes | 245 |
Standard Pacific Homes | 152 |
Providence Homes (Fl) | 146 |
TOTAL | 3,236 |
Orlando:
The Orlando MSA’s new home average closing price has grown by almost $40,000, or 15% in the 2Q14 when compared to the 2Q13. The price per square foot has grown by almost $8, or just over 7% during that same period.
Orlando |
|
Closings | Average Price |
$/SF |
| 2Q13 | 1,855 | $259,978 | $109.05 |
| 3Q13 | 1,949 | $274,837 | $110.84 |
| 4Q13 | 2,088 | $290,887 | $112.50 |
| 1Q14 | 1,699 | $290,197 | $112.53 |
| 2Q14 | 1,757 | $299,460 | $116.71 |
Not surprisingly, the market has felt this pricing pressure as the quarterly closing rate declined by 5% in the second quarter of 2014 when compared to 2Q13. New home starts (not shown here) have been flat over the past 6 quarters. Starts grew from under 1,000 units in the 2Q11, to 2,400 units in 2Q13, but have stayed in the mid-2,000 range since.
What this ultimately means is that demand will be reduced in the urban core, and increase in the outlying areas as buyers look to find, and builders work to produce more affordable product. Orlando has a mix of buyers with significant international and active adult markets, yet remains primarily a Leisure and Resort Service and Retail Trade job market, catering to first time, first time move-up and multi-generational home buyers.
Orlando
August 1, 2013 – July 31, 2014
Builder | Closings |
Lennar | 922 |
DR Horton | 852 |
Meritage Homes | 581 |
The Ryland Group, Inc. | 484 |
Kb Home | 416 |
M/I Homes | 352 |
Beazer Homes | 341 |
Pulte-Del Webb-Centex | 299 |
Taylor Morrison | 299 |
Standard Pacific Homes | 287 |
TOTAL | 4,833 |
Florida is not just one market. Activity levels and pricing power vary from one market to the next, but the entire state is set for growing demand over the next five years. From the Millennials to the Boomers, an even greater influx of residents is coming to the state. Demand from retirees is expected to be a palpable force as 10 million more people reach retirement age in the U.S. over the next 5 years. Generation Y is so far showing a tendency to rent, but that will start to change as more of them start families.
About Metrostudy
Metrostudy is the leading provider of primary and secondary market information to the housing and related industries nationwide. Metrostudy provides research, data, analytics and consulting services to help builders, developers, lenders, suppliers, retailers, utilities and others make investment and business decisions every day. For more information, visit www.metrostudy.com