(The Saga of RB Builders©, written by Fletcher Groves III in 2007, looks back futuristically from the perspective of 2012. It is being republished this year, as a nine-part series in Big Builder. It is a glance into the process of continuous improvement, a glance into the never-ending quest for better operating performance and higher economic return)
RB Builders’ intrepid, results-based consultant/advisor had taught the company to think of its production capacity as the rate of closings it could generate with a planned, finite, and controlled amount of work-in-process, and with a fixed overhead. As a result, RB Builders had consistently maintained its average work-in-process at 2007-levels (100 homes under construction). Better scheduling and production management had resulted in more than a 60% increase in the rate of closings, from 200 homes in 2007, to 325 homes in 2010. Improved flow of sales, starts, and closings had resulted in a more even spread of the work-in-process.
But–it was still 100 homes.
She had shown them how excessive levels of work-in-process reduced the rate of throughput. It was in the formula she had given them for calculating cycle time. RB Builders reasoned, what would happen if the level of work-in-process was purposely lowered?
No longer afraid of trying, failing, and learning from new ideas, the company decided to reduce current work-in-process and limit maximum work-in-process to 80 homes in 2012.
Fletcher
RB Builders’ gross income (GI) targets had always reflected a level of performance that was considered “beyond current capability,” a level of performance that was possible, but only through extraordinary amounts of urgency, intensity, focus, and motivation. Far from “business-as-usual,” the 2012 GI Baseline had not cut the company any slack–it was a stretch, itself, under the anticipated market conditions.
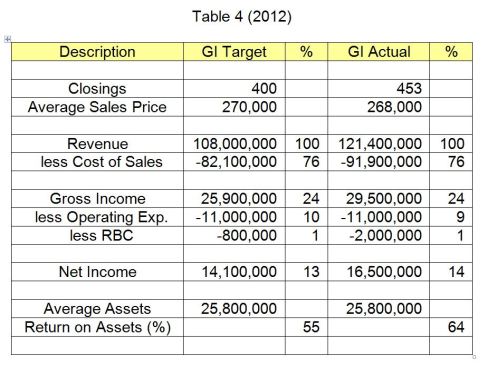
Every year, RB Builders had reached its GI Target. 2012 was a different story (see Table 4, above).
RB Builders went “beyond current capability.” It went “beyond current possibility.”
The company got serious about increasing productivity and utilizing its production capacity. It attacked resource constraints, as well as the excessive safety built into schedules to protect phase completion dates. It relentlessly attacked anything that didn’t add or create value, from the home buyer’s perspective. It reallocated personnel (freed by “doing less, but delivering more”) to more productive work, work that generated more Gross Income.
RB Builders continued to refine the ability of its operating model to deliver on its value proposition–it continued to improve the capability of its organizational structure, management and operating systems, business processes, home building team, and culture to deliver extraordinary levels of the distinctive product and service value demanded by the narrowly-defined segment of the new home-buying market the company had purposely chosen to serve.
Its product (its plans, elevations, specifications, finishes, features, options, and communities) became more distinctive and evocative; its service became more focused, more useful, and more to the point.
During 2012, RB Builders closed 453 homes, 53 more than its target. With only 80 homes under construction, cycle time dropped to 65 calendar days, 25 days less than its target (90 days). Acquiring the additional market share in a down housing market resulted in a lower average sales price, but the company had held the line on direct, variable costs, so that it met its Gross Margin Target (24%).
RB Builders’ 2012 GI Target was $25.9 million; the company generated Gross Income of $29.5 million, $3.6 million above its target. The company also held the line on indirect, non-variable costs, so that its Net Margin exceeded the target (14% versus 13%), even considering the higher cost of its results-based compensation. RB Builders had targeted Net Income of $14.1 million; when all was said and done, the company actually earned $16.5 million, $2.4 million above its target. The combination of higher Net Income and lower levels of work-in-process pushed Return on Assets to 64%, exactly eight times the economic return the company earned in 2007.
Not only had RB Builders reached its 2012 GI Target (and achieved all eight GI Milestones), it had exceeded the GI Target to the point of achieving a ninth milestone.
Since its GI Target was the sum of its GI Baseline and (projected) GI Reserve, the milestones that made up RB Builders’ GI Target (milestones 1-8) were always considered to be a blend of the expected and the extraordinary, but progressing toward extraordinary. The achievement of 2012’s GI Milestone 9, however, was purely extraordinary, in terms of anything the company had accomplished before.
With its annual overhead and the cost of its production capacity fully absorbed in the previous eight milestones–and with its projected GI Reserve more than doubled–the $3,600,000 in additional Gross Income from GI Milestone 9 was distributed in its entirety.
The employee payout went to one-third of the milestone*, to $1,200,000, more than doubling the payout for the entire year. The remainder of GI Milestone 9 ($2,400,000) was left in the company as an additional $1,200,000 in Retained Earnings, matched by distributions to owners ($1,200,000).
RB Builders looked forward to 2013 with much anticipation.
* Remember–by this time, RB Builders was on its own. The 10% that had gone to RB Builders’ intrepid, results-based consultant was being allocated evenly between additional retained Earnings, Cash Distributions to owners, and employees.