The S&P CoreLogic Case-Shiller U.S. National Home Price NSA Index, which covers all nine U.S. census divisions, recorded a 19.7% annual gain in home prices in July, up from 18.7% the previous month.
The 10-City Composite annual increase was 19.1%, up from 18.5% the previous month, and the 20-City Composite recorded a 19.9% YOY gain, up from 19.1% the previous month.
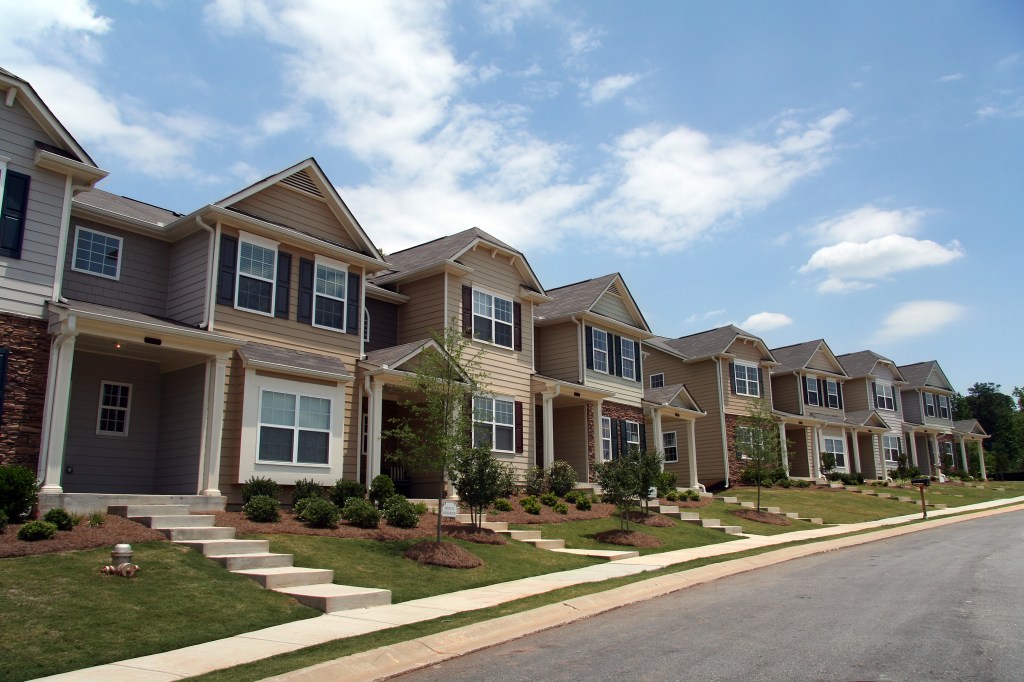
Phoenix posted the highest YOY price gain out of the top 20 cities in July, up 32.4% YOY. San Diego came in second at 27.8%, followed by Seattle at 25.5%.
“July 2021 is the fourth consecutive month in which the growth rate of housing prices set a record,” says Craig J. Lazzara, managing director and global head of index investment strategy at S&P Dow Jones Indices. “July’s 19.7% price gain for the national composite is the highest reading in more than 30 years of S&P CoreLogic Case-Shiller data. This month, New York joined Boston, Charlotte, Cleveland, Dallas, Denver, and Seattle in recording their all-time highest 12-month gains. Price gains in all 20 cities were in the top quintile of historical performance; in 15 cities, price gains were in the top 5% of historical performance.”
On a month-to-month basis, the U.S. National Home Price NSA Index rose by 1.6% in July before seasonal adjustment, and 1.5% after. The 10-City and 20-City Composite indices rose by 1.3% and 1.5%, respectively, before seasonal adjustment, and 1.4% and 1.5%, respectively, after.
“We have previously suggested that the strength in the U.S. housing market is being driven in part by a reaction to the COVID pandemic, as potential buyers move from urban apartments to suburban homes,” Lazzara says. “July’s data are consistent with this hypothesis. This demand surge may simply represent an acceleration of purchases that would have occurred anyway over the next several years. Alternatively, there may have been a secular change in locational preferences, leading to a permanent shift in the demand curve for housing. More time and data will be required to analyze this question.”