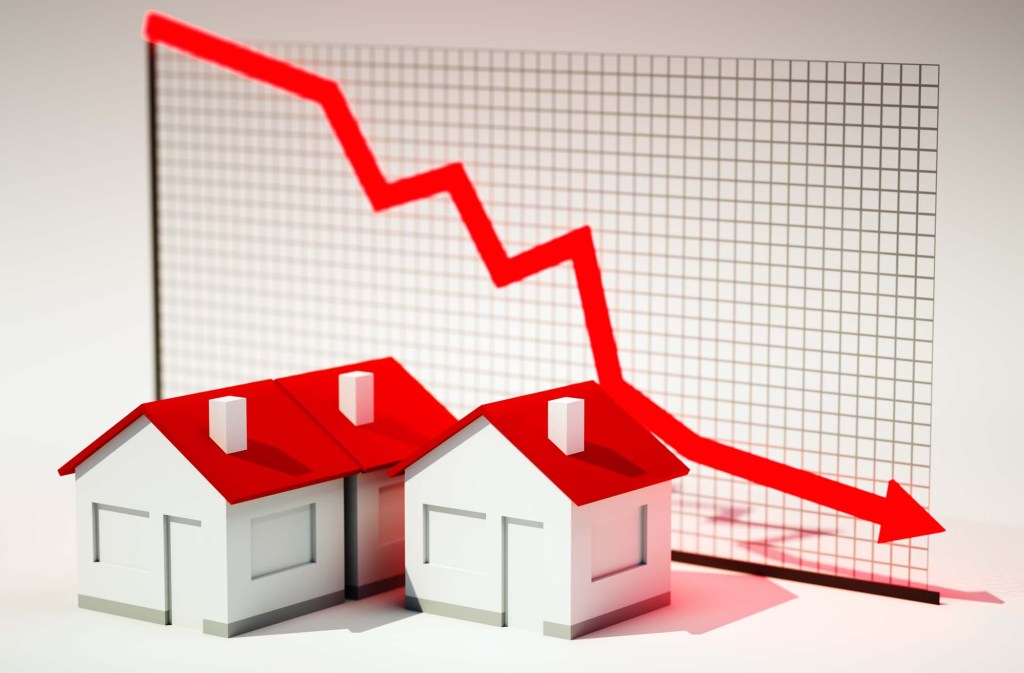
Zonda’s New Home Pending Sales Index (PSI) decreased to 149.8 in January, a 4.8% decrease from December and a 14% decrease from January 2021. The index suggests the housing market is below peak activity seen in January 2021, but it is 20.2% higher than the pre-pandemic high seen in February 2020.
“Reviewing sales data in today’s market needs to be done with a discerning eye; the market is still being distorted by industrywide challenges, including limited lot inventory, a skilled labor shortage, and supply chain delays that are holding back full potential,” Zonda chief economist Ali Wolf says. “We recognize, though, that headwinds are picking up, especially with how quickly mortgage rates have risen.”
The New Home PSI is composed of two components: new-home orders and the average sales rate per community. The new-home orders component declined 23.5% year over year (YOY) in January as supply continued to trickle lower, while the average sales rate per community decreased 13.2% YOY.
The new-home order component, which looks at total sales volume, has been impacted with ever-decreasing active project counts, according to Zonda. The average sales rate per community measure captures how well builders are selling at the open communities and strips out the supply side. With builders intentionally capping sales, even the sales rate number does not capture the full demand environment, according to Zonda. Both the new-home order volume and average sales pace rose month over month on a non-seasonally adjusted basis.
Pending new-home sales trended above January 2021 levels in three of 25 markets analyzed by Zonda, a decrease from six in December. Riverside/San Bernardino, California (4.4%); Orlando, Florida (3.2%); and Las Vegas (2.6%) registered positive YOY increases.
“The housing market in 2022 can be defined by two words: enthusiasm and panic,” says Wolf. “Buyers are trying to rush into this tight market before rates rise much higher, and builders are in a race against time to help meet the interest.”
The relationship between the percent change in the average sales rate and new-home orders can reflect an imbalance of supply and demand. Twenty-four of the 25 markets analyzed posted a positive spread, indicating current levels of volume are being restrained by lack of supply. Sales pace remains up YOY in five markets, a decline from 12 during December. No metros posted an increase on the volume side compared with a year ago.