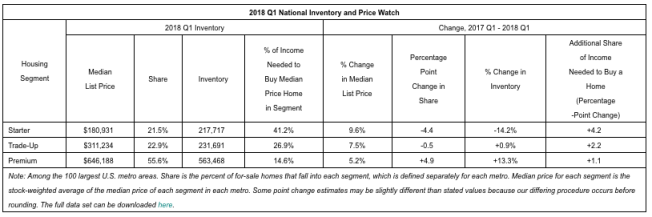
Trulia® on Wednesday released the findings from its quarterly Trulia Inventory and Price Watch, which found that national housing inventory rose 3.3% year-over-year, driven almost entirely by a 13.3% increase in premium homes.
This is the first time that inventory has hit positive territory during the first quarter since 2015. However, starter home inventory plummeted, hitting its lowest level in at least six years, and amid a 9.6% year-over-year increase in median list price.
Trulia’s Inventory and Price Watch found that first-time buyers will face a tough spring market in 2018. Not only will buyers face fierce competition in a tighter and pricier housing market, the quality of available starter homes appears to have diminished, the company said.
“First-time home buyers face a perfect storm this spring,” said Cheryl Young, senior economist at San Francisco-based Trulia. “Affordable, move-in ready starter homes have become harder to find amid rising home prices and mortgage rates. While new home construction hit a 10-year high in 2017, these units have not translated into starter home inventory just yet.”
Today, starter homes are less likely to be move-in ready with fixer-uppers making up 11.2% of the market, up from 10.3% in 2012. Most notably, Camden, N.J, Philadelphia, and Oklahoma Citysaw their share of fixer-uppers among starter homes rise the most. Moreover, starter homes nationally are nine years older on average and about 2% smaller in terms of square footage, shrinking to 1,187 square feet from 1,211 square feet six years ago.
| Where Share of Fixer-Uppers Among Starter Homes Rose Most | |||
| U.S. Metro | Fixer-Uppers as Share of Starter Homes, 2012 | Fixer-Uppers as Share of Starter Homes, 2018 | Percentage Point Change in Fixer-Uppers as Share of Starter Homes, 2012-2018 |
| Camden, NJ | 20.0% | 32.9% | +12.8 |
| Philadelphia, PA | 22.2% | 30.7% | +8.5 |
| Oklahoma City, OK | 13.0% | 21.1% | +8.0 |
| Baltimore, MD | 12.4% | 20.1% | +7.7 |
| Charlotte, NC | 12.3% | 18.6% | +6.3 |
| Note: Among the 100 largest U.S. metro areas. The full data set can be downloaded here. |
The ongoing inventory crunch continues to impact affordability across the country. Nationally, starter-home buyers now need to spend at least 41.2% of their income to buy a typical starter home – significantly more than the recommended amount. This 4.2 percentage point increase is the largest year-over-year rise on record. Regionally, California is home to the most unaffordable markets in the country. In fact, starter-home buyers in San Francisco, San Jose, Calif., and Los Angeles would need to spend more than 100% of their income to buy the median-priced starter home in those markets.
| America’s Least Affordable Housing Markets | |||
| U.S. Metro | Share of Income Needed to Buy a Starter Home (Y-o-Y Percentage Point Change) | Median Price of Starter Home (YoY % Change) | Change in Starter Home Inventory (Q1 2017 – Q1 2018) |
| San Francisco, CA | 121.8% (18.0) | $820,550 (12.4%) | +0.6% |
| San Jose, CA | 104.3% (13.6) | $692,296 (12.0%) | -20.4% |
| Los Angeles, CA | 103.5% (13.2) | $389,933 (10.9%) | -9.8% |
| Orange County, CA | 83.7% (7.2) | $461,333 (4.3%) | -11.3% |
| Ventura County, CA | 79.6% (8.8) | $421,450 (7.2%) | -36.8% |
| Oakland, CA | 76.6% (8.8) | $444,666 (8.7%) | -33.4% |
| Note: Among the 100 largest U.S. metro areas. The full data set can be downloaded here. |
“If you’re looking to buy a fixer upper, proceed with caution,” said young. “It may seem like a reasonable starter home but may be a trade-up home in disguise. In tight markets where bidding wars are common, sellers have little incentive to upgrade their properties before listing them. First-time home buyers should keep that in mind as they assess the hidden costs that comes with fixing up a home, especially if it’s an older home.”
