Add another voice to the chorus singing over the health of the housing market in 2016. RE/MAX says “2016 was the best year for U.S. home sales since the recession,” according to the its January 2017 National Housing Report.
According to the 53-market report, the trend of rising prices and shrinking inventory continued in December, even though December was one of three months that trailed 2015, with sales 1.8% below December 2015. Nearly half of the markets reported increased sales over December 2015, and almost two-thirds saw sales higher than November 2016. The median increase over November 2016 was 1.7%.
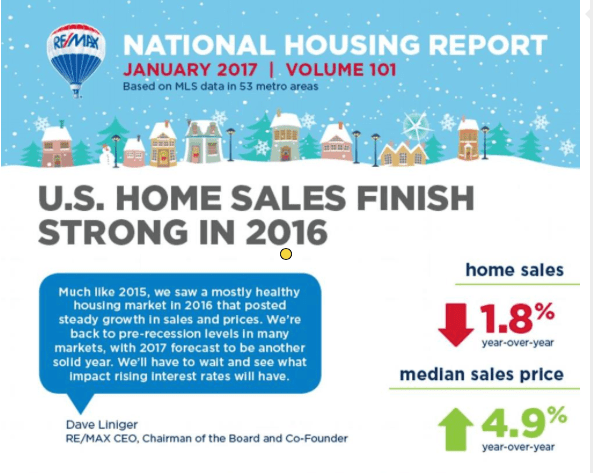
The median sales price of $216,000 was 4.9% above one year ago and 1.8% below November’s.
Inventory declined 17.9% year-over-year in December, continuing a year-long streak of double-digit declines. Months Supply of Inventory was 4.2, with 47 markets below the 6 months normally considered a balanced market.
The average Days on Market of 62 was the lowest of any December in the report’s history.
“Much like 2015, we saw a mostly healthy housing market in 2016 that posted steady growth in sales and prices,” said Dave Liniger, RE/MAX CEO, chairman and co-founder. “We’re back to pre-recession levels in many markets, with 2017 forecast to be another solid year. We’ll have to wait and see what impact rising interest rates will have.”
Of the 53 metro areas surveyed in December, the overall average number of home sales fell 1.8% compared to December 2015. But nearly half of the 53 metro areas experienced an increase in sales year-over-year, with three experiencing double-digit increases. The markets with the largest increase in sales included Wilmington/Dover, DE +21.4%, Honolulu, HI +19.7%, Augusta, ME +16.1%, Las Vegas, NV +7.9% and Providence, RI +7.3%.
In December, the median of all 53 metro Median Sales Prices was $216,000, down 1.8% from November but up 4.9% from December 2015. Of the 53 metro areas surveyed, all but two (Des Moines, IA and New Orleans, LA) saw year-over-year increases or remained unchanged with nine rising by double-digit percentages. The largest double-digit increases were seen in Birmingham, AL +17.1%, Tampa, FL +16.8%, Charlotte, NC +13.2%, Seattle, WA 12.9% and Orlando, FL +12.3%.
The average Days on Market for homes sold in December was 62, up three days from the average in November 2016, but down five days from the December 2015 average. The two metro areas with the lowest Days on Market were Omaha, NE and Denver, CO both at 36. The highest Days on Market averages continued to be in Augusta, ME at 141, and Burlington, VT at 101. Days on Market is the number of days between when a home is first listed in an MLS and a sales contract is signed.
The number of homes for sale in December was down 14.0% from November, and down 17.9% from December 2015. Based on the rate of home sales in December, the Months Supply of Inventory was 4.2, compared to November at 4.0 and December 2015 at 4.9. A 6.0-month supply indicates a market balanced equally between buyers and sellers. In December, 47 of the 53 metro areas surveyed reported a months supply of less than 6.0, which is typically considered a seller’s market. One reported a balanced market at 6.0, while the remaining five saw a months supply above 6.0, which is typically considered a buyer’s market. The markets with the lowest Months Supply of Inventory continued to be in the West, with San Francisco, CA at 1.2, Seattle, WA at 1.5 and Denver, CO at 1.6.
