CalAtlantic Group, Inc. (NYSE:CAA) after market close Wednesday reported net income of $132.3 million, or $0.97 per diluted share for the third quarter ended September 30, beating analyst expectations of a profit of $0.94 per share. The results compare with net income of $47.2 million, or $0.59 per diluted share for the prior year quarter (2016 third quarter results include the impact of $3.9 million of merger costs, compared to $11.2 million for the 2015 third quarter).
The earnings report was complicated by the merger of Standard Pacific and Ryland Homes in last year’s fourth quarter. 2016 third quarter results are for the combined company and include merger costs. The 2015 third quarter includes only the stand-alone results of Standard Pacific and includes merger related costs. Among the highlights of the combined 2016 report:
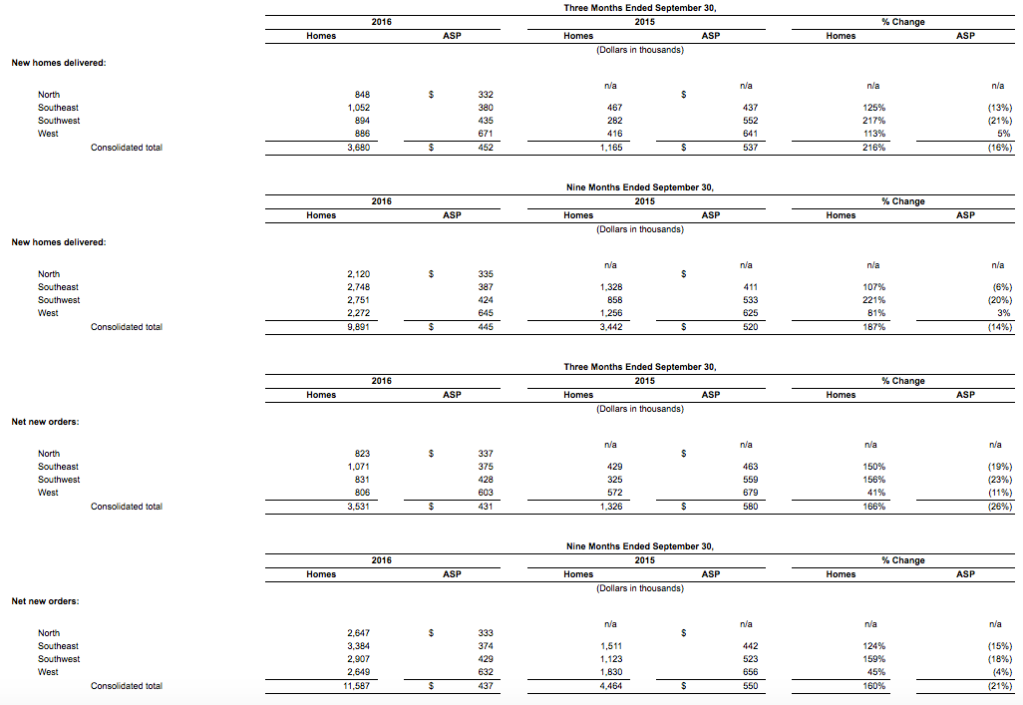
- Net new orders of 3,531, up 166%; Dollar value of net new orders up 98%
- 566 average active selling communities, up 163%
- 3,680 new home deliveries, up 216%
- Average selling price of $452 thousand, down 16%
- Home sale revenues of $1.7 billion, up 166%
- Gross margin from home sales of 22.5%, compared to 25.3%
- SG&A rate from home sales of 10.3%, compared to 11.7%
- Operating margin from home sales of $203.6 million, or 12.2%, compared to $85.4 million, or 13.6%
- Net income of $132.3 million, or $0.97 per diluted share, vs. net income of $47.2 million, or $0.59 per diluted share (2016 third quarter results include the impact of $3.9 million of merger costs, compared to $11.2 million for the 2015 third quarter)
- $387.1 million of land purchases and development costs, compared to $262.2 million
- Repurchased 1.1 million shares during the quarter at an average price of $34.12 and a total expenditure of $37.6 million
The company also provided a non-GAAP report for analysts that provided a comparison with the combined company now and what the results of the combined company would have been before the merger.
- Net new orders of 3,531, up 9%; Dollar value of net new orders up 8%
- 566 average active selling communities, flat
- 3,680 new home deliveries, up 15%
- Average selling price of $452 thousand, up 10%
- Home sale revenues of $1.7 billion, up 26%
- Pretax income of $210.7 million vs. $143.9 million* (2016 third quarter results include the impact of $3.9 million of merger costs, compared to $11.2 million for the 2015 third quarter)
- $387.1 million of land purchases and development costs, compared to $432.8 million
- Orders. Net new orders for the 2016 third quarter were up 9% from the pro forma 2015 third quarter, to 3,531 homes, with the dollar value of these orders up 8%. The Company’s monthly sales absorption rate was 2.1 per community for the 2016 third quarter, up 9% from the pro forma 2015 third quarter and down 10% from the 2016 second quarter, approximately half the decline associated with normal seasonal patterns. The Company’s cancellation rate for the 2016 third quarter was 16%, down compared to 20% for the pro forma 2015 third quarter and slightly up from 15% for the 2016 second quarter.
- Backlog. The dollar value of homes in backlog increased 10% to $3.3 billion, or 7,307 homes, compared to $3.0 billion, or 6,707 homes, for the pro forma 2015 third quarter, and decreased 3% compared to $3.4 billion, or 7,456 homes, for the 2016 second quarter. The increase in pro forma year-over-year backlog value was driven primarily by the 9% increase in the Company’s monthly sales absorption rate. As of September 30, 2016, the average gross margin of the 7,307 total homes in backlog was 21.4%. For the 4,306 homes scheduled to close in the fourth quarter of 2016, the gross margin in backlog as of such date was 21.2%.
- Revenue. Revenues from home sales for the 2016 third quarter increased 26%, to $1.7 billion, as compared to the pro forma 2015 third quarter, resulting from a 15% increase on a pro forma basis in new home deliveries and a 10% increase on a pro forma basis in the Company’s average home price to $452 thousand. The increase in average home price was primarily attributable to product mix and general price increases within select markets.
- Gross Margin. The Company achieved gross margin from homes sales of 22.5% for the 2016 third quarter. Excluding 270 bps of capitalized interest amortized to cost of home sales, our pre-interest gross margin was 25.2%*. Our 2016 gross margin was negatively impacted by a shift in product mix, a competitive pricing environment, and an increase in direct construction costs per home.
- SG&A Expenses. Selling, general and administrative expenses for the 2016 third quarter were $170.8 million, or 10.3%, as compared to $73.3 million, or 11.7%, for the 2015 third quarter. This 140 basis point improvement was primarily the result of a 166% increase in home sale revenues and the operating leverage associated with the increase in revenue and the synergies gained in connection with the merger.
- Land. During the 2016 third quarter, the Company spent $387.1 million on land purchases and development costs, compared to $432.8 million for the pro forma 2015 third quarter. The Company purchased $227.6 million of land, consisting of 3,798 home sites, of which 20% (based on home sites) is located in the North region, 37% in the Southeast region, 33% in the Southwest region, and 10% in the West region. As of September 30, 2016, the Company owned or controlled 67,964 home sites, of which 46,119 were owned and actively selling or under development, 16,579 were controlled or under option, and the remaining 5,266 home sites were held for future development or for sale.
- Liquidity. The Company ended the quarter with $675.1 million of available liquidity, including $184.0 million of unrestricted home building cash and $491.1 million available to borrow under its $750 million revolving credit facility. The Company’s home building debt to book capitalization as of September 30, 2016 and 2015 was 46.4% and 56.8%, respectively, and adjusted net home building debt to adjusted book capitalization was 44.9%* and 55.4%*, respectively. In addition, the Company’s home building debt to adjusted home building EBITDA for the LTM period ending September 30, 2016 and 2015 was 3.7x* and 4.7x*, respectively.
- Share Repurchase. During the third quarter, the Company repurchased 1.1 million shares of its common stock at an average price of $34.12 and a total third quarter spend of $37.6 million. This brings the year-to-date repurchases for the nine months ended September 30, 2016 to 4.3 million shares at an average price of $31.99 and a total year-to-date spend of $137.5 million.
