KB Home after market close on Thursday reported net income of $59.7 million, an increase of 99% from a year earlier, and diluted earnings per share of $0.63, up 103%, for its fiscal first quarter ended Feb. 29. Wall Street was expecting a gain of $0.45 per share.
In the earnings release, Jeffrey Mezger, chairman, president and CEO, stated, “Our principal focus today is the concern for the health and welfare of our employees, customers and business partners, and their families, in light of the wide-ranging efforts to contain COVID-19 and the impact it will have on the global economy. While our performance in the first quarter was strong, with underlying market conditions that were robust, these results preceded the COVID-19 pandemic declaration, and we are now taking actions to adjust our business in this period of uncertainty,” said
“KB Home is well positioned given our strong balance sheet and over $1.2 billion in liquidity,” continued Mezger. “With our Built-to-Order model, we are flexible in aligning our business to demand and building to our sales pace, mitigating inventory risk. With that foundation, we are diligently managing our operations with a focus on being both prudent and strategic with our cash resources. While we continue to close homes and generate revenues, we are also taking steps to curtail land acquisition and development until circumstances become more stabilized. We have a long-tenured, hands-on team that is experienced in navigating changing market conditions, which will help guide our actions in this challenging environment.”
As a result of the poential market disruption, KB Home withdrew its 2020 guidance.
Among the Q1 highlights:
- Revenues increased 33% to $1.08 billion, the highest revenues for any first quarter since 2007.
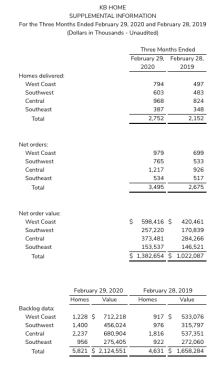
- Homes delivered grew 28% to 2,752, with increases in all four of the Company’s regions.
- Average selling price rose 5% to $389,500.
- Home building operating income increased 92% to $60.2 million. Home building operating income margin improved 170 basis points to 5.6%. Excluding inventory-related charges of $5.7 million in the quarter and $3.6 million in the year-earlier quarter, this metric was 6.1%, compared to 4.3%.
- Housing gross profit margin improved 30 basis points to 17.4%. Excluding inventory-related charges, housing gross profit margin increased to 17.9% from 17.6%.
- The housing gross profit margin expansion primarily reflected the favorable impacts of improved operating leverage due to higher housing revenues, and lower relative amortization of previously capitalized interest, which were partly offset by a mix shift of homes delivered.
- Adjusted housing gross profit margin, a metric that excludes inventory-related charges and the amortization of previously capitalized interest, was 21.1%, compared to 21.3%.
- Selling, general and administrative expenses as a percentage of housing revenues improved 160 basis points to 11.8%, largely due to increased operating leverage from higher housing revenues.
- Housing gross profit margin improved 30 basis points to 17.4%. Excluding inventory-related charges, housing gross profit margin increased to 17.9% from 17.6%.
- The company’s financial services operations generated pretax income of $5.8 million, up from $2.5 million, mainly reflecting higher income from its mortgage banking joint venture, KBHS Home Loans, LLC (KBHS).
- KBHS originated 71% of the residential mortgage loans the Company’s homebuyers obtained to finance their home purchase, compared to 64%.
- Total pretax income nearly doubled to $68.8 million.
- The company’s income tax expense was $9.1 million, compared to $4.5 million. For each period, the effective tax rate, inclusive of excess tax benefits from stock-based compensation and other favorable impacts, was approximately 13%.
Backlog and Net Orders (comparisons on a year-over-year basis)
- Net orders increased 31% to 3,495, the highest first-quarter level since 2007, with net order value up 35% to $1.38 billion. Net orders and net order value increased in all four of the Company’s regions.
- Company-wide, net orders per community averaged 4.6 per month, compared to 3.7.
- The cancellation rate as a percentage of gross orders improved to 14% from 20%.
- The company’s ending backlog rose 26% to 5,821 homes. Ending backlog value grew 28% to $2.12 billion, compared to $1.66 billion, reflecting increases in all four regions. Both metrics reached their highest first-quarter levels in 13 years.
- Average community count for the quarter rose 3% to 251. Ending community count of 250 was up slightly.
Balance Sheet as of February 29, 2020 (comparisons to November 30, 2019)
- Cash and cash equivalents totaled $429.7 million, compared to $453.8 million.
- The company had total liquidity of $1.22 billion, including cash and cash equivalents and $787.6 million of available capacity under its unsecured revolving credit facility. There were no cash borrowings outstanding under the facility.
- Inventories increased slightly to $3.73 billion.
- Lots owned or under contract decreased slightly to 63,234, reflecting fewer optioned lots. Approximately 62% of the total lots were owned and 38% were under contract.
- The company’s 39,033 owned lots represented an approximately 3.1 years’ supply based on homes delivered in the trailing 12 months.
- Notes payable of $1.75 billion were essentially unchanged.
- The company’s debt to capital ratio of 41.7% improved 60 basis points. The Company’s net debt to capital ratio was 35.1%, essentially unchanged.
- In January 2020, Standard and Poor’s Financial Services upgraded the company’s credit rating to BB from BB-, and changed its rating outlook to stable from positive.
- The company’s next scheduled debt maturity is on December 15, 2021, when $450.0 million in aggregate principal amount of its 7.00% senior notes become due.
- Stockholders’ equity increased to $2.44 billion from $2.38 billion.
- Book value per share increased to $27.01.