Toll Brothers (NYSE:TOL), the bellwether stock for the national luxury housing market, on Tuesday reported net income for its fiscal fourth quarter ended Oct. 31 of $114.4 million, or $0.67 per share, compared to $147.2 million, or $0.80 per share diluted, in the 2015 fourth quarter. The gain missed estimates of $0.99 per share on an $121.2 million charge related to warranty repairs of older homes built with stucco and $2.5 million in inventory impairments. Still, the revenue for the quarter exceeded analyst expectations.
“While there has been some debate about softness in the luxury housing market, we continue to produce impressive results by serving what we believe is the demographic sweet spot in this market,” said Douglas C. Yearley, Jr., Toll CEO. “We are not focused on super-luxury. With an average delivered home price of approximately $850,000 company-wide in FY 2016 – and $690,000 in markets other than New York City and California – our product lines are affordable to many households in the U.S.”
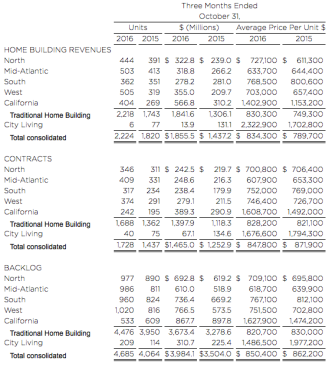
Revenue of $1.86 billion and home building deliveries of 2,224 units rose 29% in dollars and 22% in units, compared to FY 2015’s fourth-quarter totals of $1.44 billion and 1,820 units. The average price of homes delivered was $834,000, compared to $790,000 in FY 2015’s fourth quarter.
Net signed contracts of $1.47 billion and 1,728 units rose 17% in dollars and 20% in units, compared to FY 2015’s fourth-quarter totals of $1.25 billion and 1,437 units. The average price of net signed contracts was $848,000, compared to $872,000 in FY 2015’s fourth quarter.
On a per-community basis, FY 2016’s fourth-quarter net signed contracts were up 12% to 5.82 units, compared to fourth-quarter totals of 5.21 units in FY 2015, 5.01 in FY 2014 and 5.17 in FY 2013, the highest fourth quarter per-community total since FY 2005.
For the first five weeks of FY 2017, beginning November 1, 2016, non-binding reservations deposits were up 10% in units, compared to the same period in FY 2016. Adjusting for outstanding Coleman Homes deposits inherited at the time of its acquisition in early November 2016, deposits were up 14%.
Backlog of $3.98 billion and 4,685 units increased 14% in dollars and 15% in units, compared to FY 2015’s fourth-quarter-end backlog of $3.50 billion and 4,064 units. The average price of homes in FY 2016’s fourth-quarter-end backlog was $850,000, compared to $862,000 at FY 2015’s fourth-quarter end.
Gross margin, as a percentage of revenues, was 15.4% in FY 2016’s fourth quarter, compared to 22.3% in FY 2015’s fourth quarter. Adjusted Gross Margin, which excludes interest and inventory write-downs (“Adjusted Gross Margin”), further adjusted for the warranty charge, was 24.9%, compared to 27.0% in FY 2015’s fourth quarter.
SG&A, as a percentage of revenues, improved to 8.1%, compared to 8.7% in FY 2015’s fourth quarter.
Other income and Income from unconsolidated entities totaled $32.7 million, compared to $21.6 million in the fourth quarter of FY 2015.
The company ended FY 2016 with 310 selling communities, compared to 297 at FY 2016’s third-quarter end, and 288 at FYE 2015. Toll said itexpects similar community count growth in FY 2017.
At FYE 2016, the Company had approximately 48,800 lots owned and optioned, compared to approximately 48,700 at FY 2016’s third-quarter end and approximately 44,300 one year ago.
Toll ended FY 2016’s fourth quarter with a debt-to-capital ratio of 47.2%, compared to 48.2% at FY 2016’s third-quarter end and 47.3% at FY 2015’s fourth-quarter end. The Company ended FY 2016’s fourth quarter with a net debt-to-capital ratio of 40.9%, compared to 44.9.% at FY 2016’s third-quarter end and 39.5% at FY 2015’s fourth-quarter end. It also ended FY 2016 with $633.7 million of cash and marketable securities, compared to $351.9 million at FY 2016’s third-quarter end and $929.0 million at FYE 2015. At FYE 2016, the Company also had $961.8 million available under its $1.295 billion 20-bank credit facility, which matures in May 2021.
Yearley continued, ““We are encouraged as we look to FY 2017. In addition to a backlog that is up double digits in both dollars and units compared to one year before, we are seeing positive demand trends in many regions. Through the first five weeks of FY 2017, our non-binding reservation deposits in units, a precursor to signed contracts and, eventually, to home deliveries, were up 10% compared to FY 2016’s same period.”
Robert I. Toll, executive chairman, said “Recent data highlights the continuing recovery of home prices to pre-recession levels. This should translate into more equity for current home owners looking to move up.”
Toll continued, “We are encouraged by surveys that indicate most millennials still believe home ownership is a goal to aspire to. In Monday’s Wall Street Journal, an Urban Land Institute study noted that suburbs are outstripping cities in population growth. Don’t forget that more than 90% of our business is transacted in the suburbs.”